
Logiciel libre de géométrie, d'analyse et de simulation multiplateforme par Yves Biton
Toutes les versions de cet article : [English] [Español] [français]
Please use JavaScript 5.5.4 version of MathGraph32 (ou a more recent one).
We want to graph an approximation of the blancmange function, continuous everywhere but differentiable nowhere (and periodical of period 1).
This function is defined by : $blanc(x)=\sum_{n=0}^{+\infty}\frac{1}{2^k}\left| 2^kx-\left[ 2^kx+\frac{1}{2} \right] \right|$ where [x] stands for integrer part of x.
Let us start with a new figurewmith an orthonormal frame with icon  . Choose Figure with frame and ask for a frame with dots and without scaling of axes.
With capture icon  ,drag point O toward the left bottom of the figure and drag point I away from O (just like the figure at the bottom of this article).
We will now create a cursor with integer values values of which will be named k with icon  .
.
Click on the top left of the figure (this will be the left edge of the cursor) and fill in the dialog box as shown below (#I is for italic and #N for a return to a normal font).
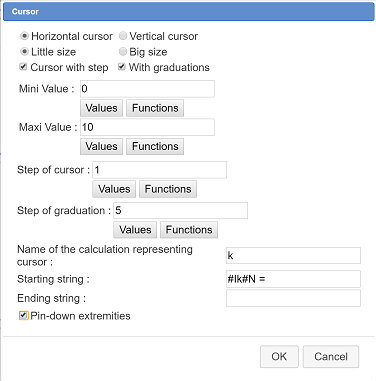
You can use a bigger font for the display of the cursor value with tool  (modification of graphical object).
Let us now create a function of two variables g. Expand the toolbar for cursors and calculations, click on icon  and choose Real function of two variables. The formula for the function is
 1/2^n*abs(2^n*x-int(2^n*x+1/2)).
We go on with the creation of a function fk defined by $f_k(x)=\frac{1}{2^k}\left| 2^kx-\left[ 2^kx+\frac{1}{2} \right] \right|$.
In the color palette, activate the purple color then use icon  (expand the horizontal toolbar with the cursor icon).
Fill in the dialog box as shown below :
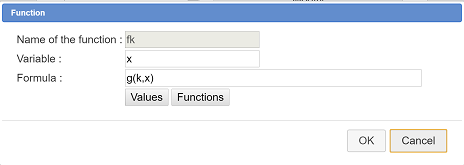
The graph of function fk appears. If you capture the cursor with tool you see this curve change in real time.
Now we want to create function f (approximation of function blanc wich will be the sum of functions fk for k ranging from 0 to 10).
In the color palette, activate the blue color.
Use icon . Fill in the dialog box as shown below :
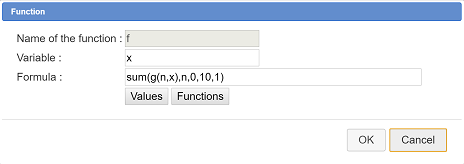
Here we ask for 2000 points because this curve is very complicated. Note that if you click oh the predefined function button you can see the syntax of the sum function.
To show how the approximation is fit, we will create a last function h and graph it.
In the color palette activate the green color.
Use icon . Fill in the dialog box as below :
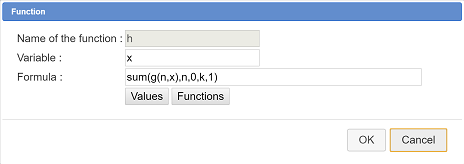
Now move the cursor to change the value of k (icône ).
To finish we can create three LaTeX displays in the same color as the curves with tool  .
.
Here is the code for these LaTeX displays :
f_k(x)=\frac{1}{2^k}\left| 2^kx-\left[ 2^kx+\frac{1}{2} \right] \right|
f(x)=\sum_{n=0}^{10}f_n(x)
g(x)=\sum_{n=0}^{k}f_n(x)
And below the figure animated with MathGraph32 JavaScript library.
 Accueil
 Présentation
 FAQ
FAQ Contact

