
Logiciel libre de géométrie, d'analyse et de simulation multiplateforme par Yves Biton
Toutes les versions de cet article : [English] [Español] [français]
In this example we will demonstrate how to display dynamical LaTeX code in a MathGraph32 figure.
This article has been adapted to the JavaScript of MathGraph32.
Create a new figure with icon  of the upper toolbar , choose an orthonormal frame and validate the default choices.
With icon  make sure the figure uses the radian for unity angle.
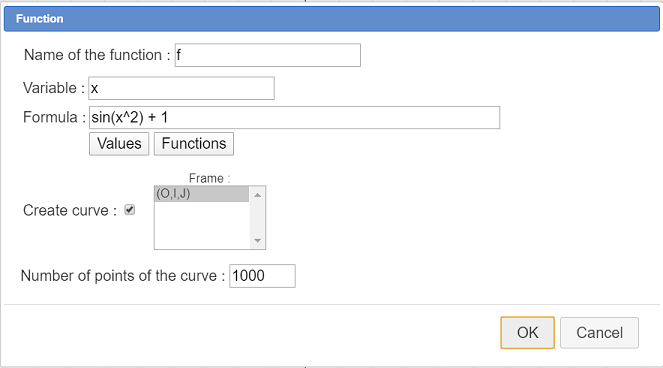
Use icon  to create a function f defined by f(x) = sin(x^2) + 1. Let the checkbox Create curve checked and ask for 1000 points as underneath.
Validate. The curve appears.
Expand the points creation toolbar and use icon  to create a point linked to the x-axis and name it a (icon
  ).
).
In the same way, create another linked point linked to the x-axis and name it b.
Expand the measures toolbar and use icon  to measure the x-coordinate of point a (click on the point. A dialog box pops up asking for the name of this measure : entera.
In the same way, create the x-coordinate of point b and name it b.
Now we want to graph a part of the curve of function, restricted to the interval [a ;b].
In the color palette, use the blue color.
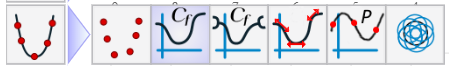
Expand the toolbar of locuses and curves and use icon  like underneath :
Fill in the dialog box as shown here :
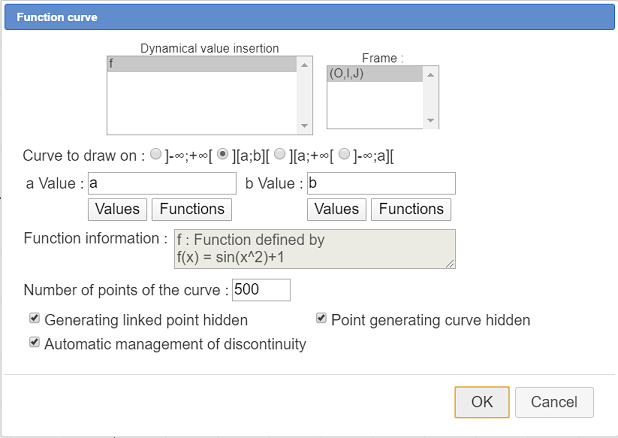
The function curve on interval [a ; b] appears.
Now we will fill the surface delimited by this last curve (it is a point locus) and the x-axis .
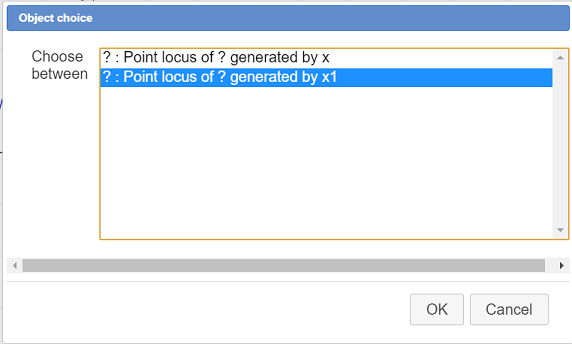
Clik on icon  (creation of a surface delimited by a point locus ans a line). Click on the blue curve (you will have to specify it is the second of the two locuses as shown above) then click on the x-axis. The surface appears.
Now we are going to calculate an approximated value of the integral of function f between the bounds a and b.
Expand the calculations toolbar as shown above and click on icon  to create a real calculation that will contain the integral.

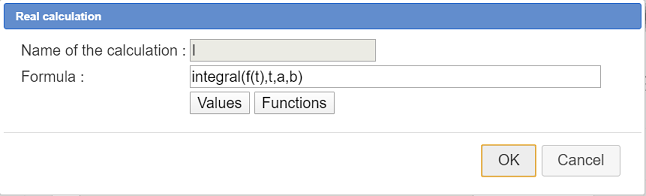
In the dialog box popping up, enter I as name then click on button Fonctions displaying all the predefined functions of MathGraph32 and their syntax. In the list, click on integral and validate. The edit field now contains integral(,,,).
Complete the formula as shown here : integral(f(t),t,a,b)
The first parameter is the formula to be integrated. The second parameter is the name for the formal variable of integration (here t), the third is the lower bound integration and the last aprameter is the upper bound of integration.
Now we will create a free LaTeX display (ie not linked to a point).
For this, expand the displays toolbar, click on icon then click on a free spot in the bottom left side of the la figure.

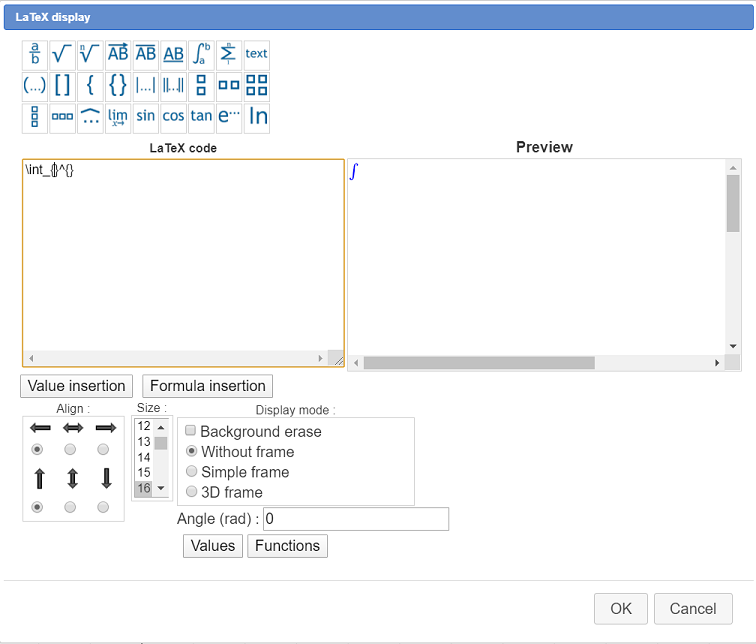
In the dialog box popping up, click on icon  .
.
The marching LaTeX code is inserted as shown underneath and the caret is blinking inside the couple of braces that will contain the lower bound.
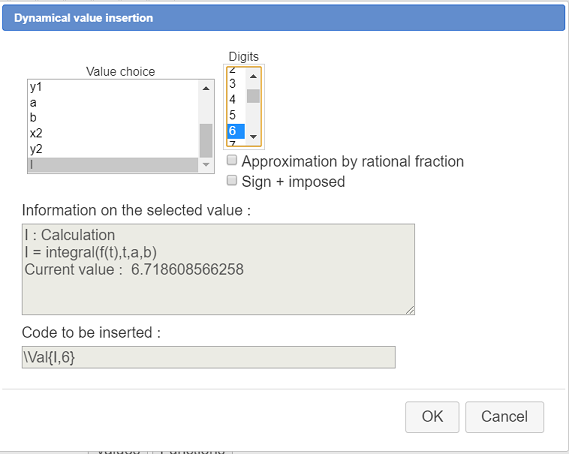
We will insert there a dynamic display of a value. For this click on button Value insertion.
In the list of calculations, select a then click on button OK.
The LaTeX code is now : \int_{\Val{a} }^{ } .
Now set the caret position inside the second couple of braces and use button Value insertion to insert the code for a dynamic display of b value.
The LaTeX code is now \int_{\Val{a}}^{\Val{b}} .
Complete this code as this : \int_{\Val{a}}^{\Val{b}} f(t)dt =
the use button Value insetion to get the code for a dynamic display of I value with 6 digits like here :
The LaTeX code is now :\int_{\Val{a}}^{\Val{b}} f(t)dt = \Val{I,6}
In the list Size select 18 (characters size), check the checkbox Background Erase and validate.
If you want to modify this LaTeX display, just click on tool  of the upper toolbar and click on the LaTeX display.
Here is the dynamic figure you must get :
You can capture points a and b and see that the LaTeX display is dynamic.
 Accueil
 Présentation
 FAQ
FAQ Contact

