
Logiciel libre de géométrie, d'analyse et de simulation multiplateforme par Yves Biton
Toutes les versions de cet article : [English] [Español] [français]
We want to visualize the set of points which affix z0 is such as the recurrent sequence graph defined by $z_{n+1}=z_n^2-1$ is a limited sequence and we want to visualize the behaviour of such a sequence regarding the sequence first term.
Here is the figure we want to get, animated by the MathGraph32 JavaScript library. You can capture point M and click on + et - buttons to visualize the 50 first terms of the sequence.
To be noted : The figure is more fluid with Chrome or Edge browser (both based on chromium now).
The following explanations are adapted to the MathGraph32 JavaScript version.
First use tool  of the upper toolbar to create a new figure and choose Figure with frame.
Choose an orthonormal frame without grid.
With capture tool  move point I away from point O just as the figure above.
With icon
In the color palette, activate the blue color.
With tool  (expanding the transformations toolbar), create the images images H’ and K’ of H and K through the central symmetry of center O (click first on point O, symmetry center, then click on points H and K).
Use icon  to join points K et K’ by a segment.
With tool  create a point P linked to segment [KK’].
Now use tool ![]() to create the images Q and Q’ of points H and H’ through the translation of vector $\overrightarrow{OP}$ (click first on points O and P then on points H and H’).
to create the images Q and Q’ of points H and H’ through the translation of vector $\overrightarrow{OP}$ (click first on points O and P then on points H and H’).
Join points Q and Q’ by a segment (icon ).
In the color palette, activate the red color and, with icon , create a point M0 linked to segment [QQ’].
We will now ask the software to measure the complex affix of point M0 in the frame (O ;I,J). For this, expand the measures toolbar, use icon  and click on point M. A dialog box pops up : Enter u0 for name of this affiix and validate.
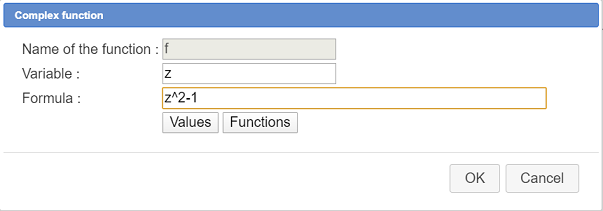
In order to create a complex recurrent sequence, we must first createe a complex function of one variable. Use icon  (expanding the calculations toolbar, third starting from the bottom) and fill the dialog box as underneath.
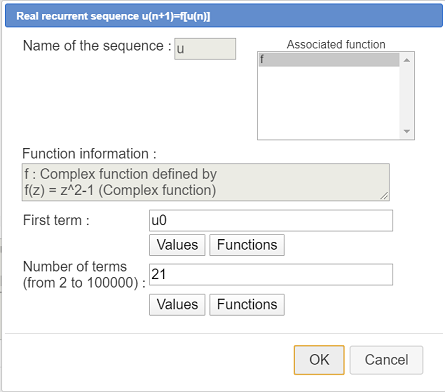
In order to create the recurente sequence, use icon  (same toolbar as before) and fill in the dialog box as underneath :
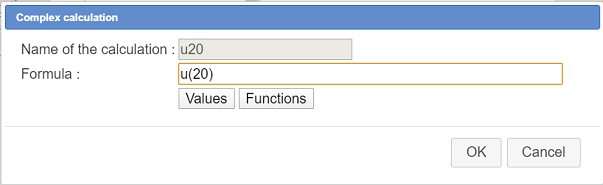
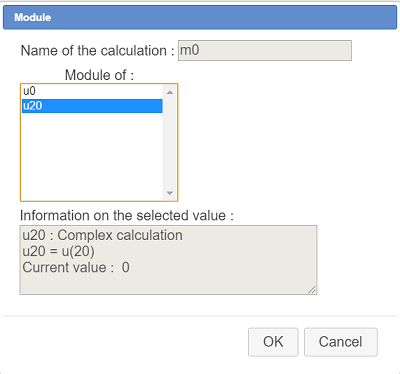
Now use icon  to create a complex calculation named u20 with formula
 u(20) as shown here :
To be noticed : You may have a warning saying this calculation does’t exist (for overflow capacity reason). In such a case, accept nontheless the creation and make point M0 nearer point P and point P nearer point O. Verify with key function F3 that calculation u20 exists (or use icon  ).
).
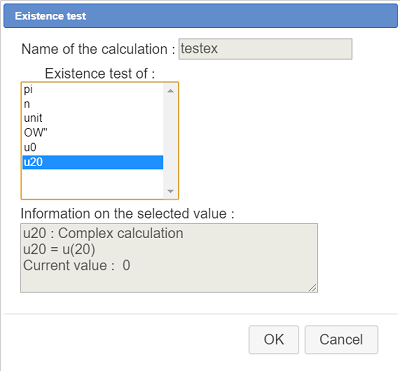
We will now create an existence test.
For this, expand the calculations tollbar and and click on icon  making a dialog box popping up.
In the list displayed, chooseExistence test to create an existence test of u20 named testex : If u20 exists, testex value will be 1 and otherwise it will be 0.
Fill in the dialog box as this :
One more time, xpand the calculations toolvbar and click on icon
Choose in the list Module id order to create a calculation named m0 which will contain the module of u20 as shown underneath :
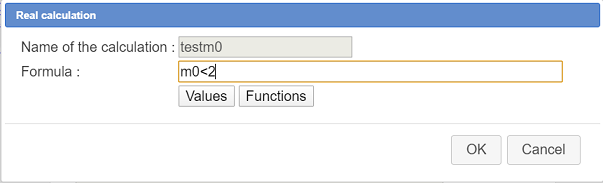
Now let’s create a real calculation named testm0 value of which will be 1 if mo is inferior to 2 et 0 else. For this use icon  . Fill in the dialog box as shown here :
Once more create a real calculation named test with formula if(testex,testm0,0). So, if the complex calculation u20 exists and if the module of u20 est strictly inferior to 2, test value will be 1 and, in all other cases, test value will be 0.
With capture tool , make point P be near point M0 and point M0 near enough to point P so that module of u20 will be strictly inferior to 2. Use function key F3 or cklick on icon to verify that test value is 1.
We will now create a point of affix of which will be u0 if test value is 1 and which will not exist otherwise.
In the point style palette, activate the "pixel" style (bottom left corner of this palette).
Expand the points creation toolbar and use icon  to define a point through it’s complex affix.
In the affix input of the dialog box, enteru0/test and validate.
Let’s create the object locus of this last point, locus generated by the moving positions of point M0 on the segment it is linked to.
For this, activate icon  (sixth toolbar starting from the bottom).
First you are asked to click on the object traces of which will generate the locus. Clcik on the last point created (you will be asked to specify the type of the object : choose "Point through affix").
Then you will be asked to click on the linked point positions of which will generate the locus : Click on point M0 . Ask for on abject locus of 200 values.
In the color palette, activate a light grey of your choice (click on the ellipse to choose a personnalized color).
Again click on icon . This time, click on the object locus you just created before, then click on point P (point positions of which will generate the locus). Ask for 50 objects (for a start).
So we just created an object locus of an object locus.
Capture points H and K for the object locus to be complete without too many losses for the points which do not exist (see the figure on top of this page).
So we have in grey an approximation of the Julia set.
Now we will increase the number of objects of the last object locus.
In the upper toolbar, click on icon  then click on the grey object locus. Now set the number of objects to 150 instead of 50 and validate.
Use now tool  to mask points H, H’, K, K’, P, Q, Q’, M0 and the point created by affix, the segment [QQ’] and the first object locus.
We will now visualize the complex sequence terms on the figure.
Use  to create a free point (better if this point lays inside the Julia set).
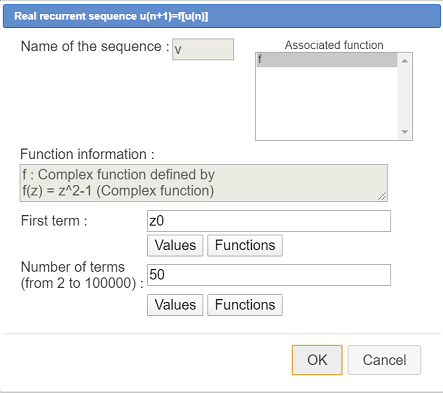
Use icon to measure this points’s affix and get it named z0.
Use icon to create a new complex recurrent sequence associated to function f with z0 as first terrm, like this :
We are now going to create the graph of this complex sequence. In the line style palette, activate the dotted line style, and activate the blue color in the color palette.
Use icon  and fill-in the dialog box as shown underneath. The sequence graph appears. Each term of the sequence is represented by a point (point affix of which is the sequence term) and each point is connectd to the preceeding one by a segment
.
To be noted : You can change the point style used for this sequence graph (along with the line style and color) by making the relative choices in the palettes and then by clicking on the graph after the activation of palette tool  .
.
Let us complete the figure.
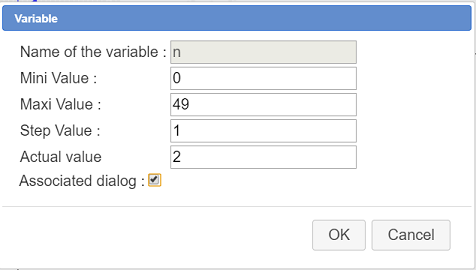
With tool  (expanding the calculations toolbar) create a variable namedn as shown below (don’t forget to check the Associated dialog checkbox) :
Now use icon to create a complex calculation named zn with forrmula v(n).
In the point syle palette, activate the mid-size circle poitn style and activate the red color in the color palette.
Create the point of affix zn with tool (expanding the points toolbar).
We want now to visualize the value of affix zn making n vary with buttons + et - associated with variable n.
Let us create a LaTeX display linked to this last point : Activate icon  , click on the last point created and enter in the LaTeX edit field Code LaTeX :
 M_{\Val{n}} (You can use the button Value insertion). LaTeX code \Val is specific to MathGraph32 and get the display of a value.
Use and create a complex module named modzn containing the module of the complex calculation zn.
Let us now create two free LaTeX displays in the top left corner of the figure with icon  .
.
First click on the spot the first LaTeX dispaly is to be displayed to.
In the first LaTeX display, enter code z_{\Val{n}}\approx \Val{zn,3} (you ca use button Value insertion).
In the second LaTeX display, enter LaTeX code \left| z_{\Val{n}} \right|\approx \Val{modzn,3}.
The figure is now completed.
If you want to get this figure directly, you can use icon of the upper toolbar and choose Figure through base 64 code. Then paste in the edit field the string below.
TWF0aEdyYXBoSmF2YTEuMAAAABI+TMzNAAJmcv###wEA#wEAAAAAAAAAAARRAAACpQAAAQEAAAAAAAAAAQAAADH#####AAAAAQAKQ0NhbGNDb25zdAD#####AAJwaQAWMy4xNDE1OTI2NTM1ODk3OTMyMzg0Nv####8AAAABAApDQ29uc3RhbnRlQAkh+1RELRj#####AAAAAQAPQ1ZhcmlhYmxlQm9ybmVlAP####8AAW5AHAAAAAAAAAAAAAAAAAAAQEiAAAAAAAA#8AAAAAAAAAEAATAAAjQ5AAEx#####wAAAAEACkNQb2ludEJhc2UA#####wAAAAAADgABTwDAKAAAAAAAAAAAAAAAAAAABQABQHWgAAAAAABAbIzMzMzMzf####8AAAABABRDRHJvaXRlRGlyZWN0aW9uRml4ZQD#####AQAAAAAOAAABAAEAAAACAT#wAAAAAAAA#####wAAAAEAD0NQb2ludExpZURyb2l0ZQD#####AAAAAAAOAAFJAMAYAAAAAAAAAAAAAAAAAAAFAAFAa4mZmZmZmAAAAAP#####AAAAAQAJQ0Ryb2l0ZUFCAP####8AAAAAABAAAAEAAQAAAAIAAAAE#####wAAAAEAFkNEcm9pdGVQZXJwZW5kaWN1bGFpcmUA#####wAAAAAADgAAAQABAAAAAgAAAAX#####AAAAAQAJQ0NlcmNsZU9BAP####8BAAAAAAEAAAACAAAABP####8AAAABABBDSW50RHJvaXRlQ2VyY2xlAP####8AAAAGAAAAB#####8AAAABABBDUG9pbnRMaWVCaXBvaW50AP####8BAAAAAA4AAAEFAAEAAAAIAAAACgD#####AAAAAAAOAAFKAMAoAAAAAAAAwBAAAAAAAAAFAAIAAAAI#####wAAAAIAB0NSZXBlcmUA#####wDm5uYAAQAAAAIAAAAEAAAACgAAAAAAAAEAAAAAAAAAAAAAAAEAAAAAAAAAAAAAAAE#8AAAAAAAAAAAAAE#8AAAAAAAAP####8AAAABAApDVW5pdGV4UmVwAP####8ABHVuaXQAAAAL#####wAAAAEAC0NIb21vdGhldGllAP####8AAAAC#####wAAAAEACkNPcGVyYXRpb24DAAAAAT#wAAAAAAAA#####wAAAAEAD0NSZXN1bHRhdFZhbGV1cgAAAAz#####AAAAAQALQ1BvaW50SW1hZ2UA#####wEAAAAAEAACVyIBAQAAAAAEAAAADf####8AAAABAAlDTG9uZ3VldXIA#####wAAAAIAAAAOAAAABQD#####AQAAAAAQAAFIAAAAAAAAAAAAQAgAAAAAAAAFAAE#+uTsl#8SBAAAAAUAAAAFAP####8BAAAAABAAAUsAAAAAAAAAAABACAAAAAAAAAUAAb#ryZ2wv4GUAAAABv####8AAAABABFDU3ltZXRyaWVDZW50cmFsZQD#####AAAAAgAAABAA#####wEAAP8AEAACSCcAAAAAAAAAAABACAAAAAAAAAUAAAAAEAAAABIAAAAQAP####8BAAD#ABAAAksnAAAAAAAAAAAAQAgAAAAAAAAFAAAAABEAAAAS#####wAAAAEACENTZWdtZW50AP####8BAAD#ABAAAAEAAQAAABEAAAAUAAAABQD#####AAAA#wAQAAFQAAAAAAAAAAAAQAgAAAAAAAAFAAE#1pePbVhugAAAABX#####AAAAAQAMQ1RyYW5zbGF0aW9uAP####8AAAACAAAAFgAAABAA#####wEAAP8AEAABUQAAAAAAAAAAAEAIAAAAAAAABQAAAAAQAAAAFwAAABAA#####wEAAP8AEAACUScAAAAAAAAAAABACAAAAAAAAAUAAAAAEwAAABcAAAATAP####8BAAD#ABAAAAEAAQAAABgAAAAZAAAABQD#####Af8AAAAQAAJNMAAAAAAAAAAAAEAIAAAAAAAABQABP97ZVufxPg0AAAAa#####wAAAAIADUNNZXN1cmVBZmZpeGUA#####wACdTAAAAALAAAAG#####8AAAABAA1DRm9uY0NvbXBsZXhlAP####8AAWYABXpeMi0xAAAADgH#####AAAAAQAKQ1B1aXNzYW5jZf####8AAAACABFDVmFyaWFibGVGb3JtZWxsZQAAAAAAAAABQAAAAAAAAAAAAAABP#AAAAAAAAAAAXr#####AAAAAQARQ1N1aXRlUmVjQ29tcGxleGUA#####wABdQAAAAFANQAAAAAAAP####8AAAABABdDUmVzdWx0YXRWYWxldXJDb21wbGV4ZQAAABwAAAAd#####wAAAAEAD0NDYWxjdWxDb21wbGV4ZQD#####AAN1MjAABXUoMjAp#####wAAAAEAFkNBcHBlbEZvbmN0aW9uQ29tcGxleGUAAAAeAAAAAUA0AAAAAAAA#####wAAAAEADkNUZXN0RXhpc3RlbmNlAP####8ABnRlc3RleAAAAB######AAAAAQAHQ01vZHVsZQD#####AAJtMAAAAB######AAAAAQAHQ0NhbGN1bAD#####AAZ0ZXN0bTAABG0wPDIAAAAOBAAAAA8AAAAhAAAAAUAAAAAAAAAAAAAAHwD#####AAR0ZXN0ABNzaSh0ZXN0ZXgsdGVzdG0wLDAp#####wAAAAEADUNGb25jdGlvbjNWYXIAAAAADwAAACAAAAAPAAAAIgAAAAEAAAAAAAAAAP####8AAAABAA9DUG9pbnRQYXJBZmZpeGUA#####wH#AAAAEAAAAAAAAAAAAAAAQAgAAAAAAAAFAAAAAAsAAAAOAwAAABoAAAAcAAAAGgAAACP#####AAAAAgASQ0xpZXVPYmpldFBhclB0TGllAP####8BAH8AAAAAJAAAAAFAYsAAAAAAAAAAABsAAAAJAAAAGwAAABwAAAAeAAAAHwAAACAAAAAhAAAAIgAAACMAAAAkAAAAIgD#####APLy8gAAACUAAAABQGkAAAAAAAAAAAAWAAAADwAAABYAAAAXAAAAGAAAABkAAAAaAAAAGwAAABwAAAAeAAAAHwAAACAAAAAhAAAAIgAAACMAAAAkAAAAJQAAAAMA#####wAAAAAAEAABTQAAAAAAAAAAAEAIAAAAAAAABQABQHggAAAAAABAYkzMzMzMzQAAABUA#####wACejAAAAALAAAAJwAAABkA#####wABdgAAAAFASQAAAAAAAAAAABoAAAAoAAAAHf####8AAAABABdDR3JhcGhlU3VpdGVSZWNDb21wbGV4ZQD#####AAAA#wEBAAAAKQAAAAsBBQAAABsA#####wACem4ABHYobikAAAAcAAAAKQAAABoAAAABAAAAIQD#####AP8AAAAQAAAAAAAAAAAAAABACAAAAAAAAAUAAAAACwAAABoAAAAr#####wAAAAIABkNMYXRleAD#####AP8AAAEAAAAsEAAAAAAAAAAAAAAAAAABAAAAAAAAAAAAC01fe1xWYWx7bn19AAAAHgD#####AAVtb2R6bgAAACsAAAAkAP####8A#wAAAf####8SQDUAAAAAAABAO2ZmZmZmZgAAAAAAAAAAAAAAAAABAAAAAAAAAAAAHXpfe1xWYWx7bn19XGFwcHJveCBcVmFse3puLDN9AAAAJAD#####AP8AAAH#####EEAyAAAAAAAAQE8zMzMzMzQAAAAAAAAAAAAAAAAAAQAAAAAAAAAAAC9cbGVmdHwgel97XFZhbHtufX0gXHJpZ2h0fFxhcHByb3ggXFZhbHttb2R6biwzfQAAAA###########w== Accueil
 Présentation
 FAQ
FAQ Contact

