
Logiciel libre de géométrie, d'analyse et de simulation multiplateforme par Yves Biton
Toutes les versions de cet article : [English] [Español] [français]
This article refers to the JavaScript version of MathGraph32 and will show how to use a macro construction in an interative way. Please use 7.3.5 version of MathGraph32 or a more recent one.
Use icon  of the upper toolbar and ask for a figure with a frame (system of coordinates).
Then use icon  to create a function named f with x as formal variable and formula x^2. Let the checkbox Create curve checked.
Now use icon  to create a calculation a with formula 1.5.
The three sources objects of our construction will be the frame (O ;I,J), the funcition f and the calculation a. Therefore our final objects must depend only on these three objects. For instance we can’t use line (OI) because the frame (O ;I,I) has been defined with O as origin. So use tool  to mask the x-axis of the frame.
Now use icon  to create a point of coordinates (0 ; 0) and a point of coordinates (1 ; 0) then icone
  to create a line going through these two points (choose Point through coordinates in the dialog box popping up when you click on each point).
In the line style palette, activate the dotted line.
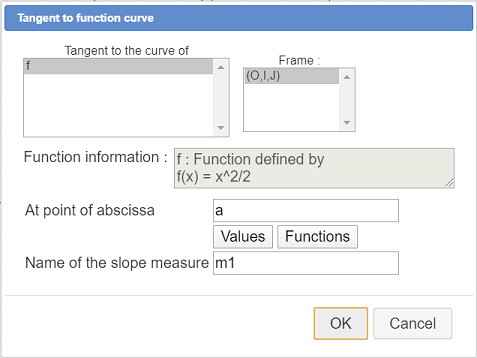
Use icon  to create the tangent to the curve at the abscissa a like underneath :
Then, expanding the points toolbar, use tool to create the intersection between this tangent and the line going through points of coordinates (0 ; 0) and (1 ;0) we created before.
Use  to name this last point A checking the checkbox Name masked.
Now expand the measures toolbar and use icon  to measure the abscissa of point A in the frame. A dialog box pops up asking for the name of this measure. Enter x for name and validate.
The first two sources objects of our future iterative construction (the frame and the function) will be shared by all the implementations of the construction but the third source object (calculation a) will be, in each iteration, replaced by the first of the final objects, this one being x.
In MathGraph32, numerical sources objects are always chosen first, so the other final objects have to be created after the calculation x.
So we are going to use clones of objects.
At the bottom of the left vertical toolbar, click on icon  and choose item Create a clone of an object. Click on point A to create a clone of this object.
Again, with this same tool, create a clone of the tangent (clone of a line then).
Use icon to create two points of coordinates (a ; 0) and (a ; f(a)).
In the line style palette, activate the dotted line style then join these two last points by a segment with icon  .
.
Our figure is now ready for the creation of our construction.
First click in the upper toolbar on icon  that makes a few more tools available.
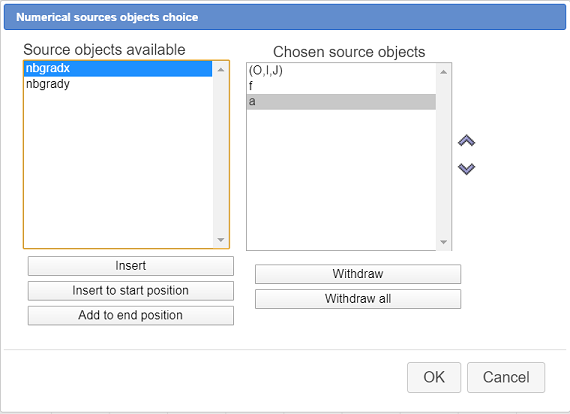
Click on icon  (construction creation) and choose item Numerical sources objects choice.
A dialog box pops up. In the left list , double click in this order on (0 ;I,J), f and a (or use button Insert) as shown here :
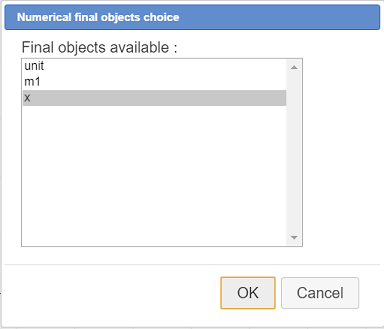
Let us define the final numerical objects. There is only one of them : calculation x.
Click again on icon (construction creation) and choose item Final numérical objects choice.
Fill in the dialog box as shown here (just click on an element of the list to get it selected on unselected).
Again click on icon and choose item Graphical final objects choice.
Click on : the clone of point A, the clone of the tangent, the point of coordinates (a ; 0), the point of coordinates (a ; f(a)) and the segment joining these two points. Then, on the right bottom side of the window, click on the red button  to indicate that all the grapical final objects have been selected.
All we ave to do now is to finalize our construction (this construction has no graphical source object).
Again click on icon and choose item Finish current construction and fill in the dialog box as shown here :
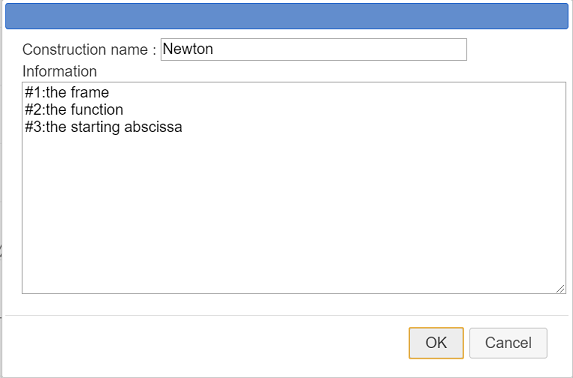
Here is the content of the Information editor :
Each line of these three lines will be used to display an information message when using the construction.
Now save your file in the directory of your choice (the construction is part of the figure).
We are also going to save our construction in a separate file (with suffix mgc).
For this use icon  and choose item Save a construction of the figure.
A dialog box pops up. In the list, construction Newton is already selected.
Click on button Save and save macro construction in the directory of your choice (It is recommended to keep the same name for the file and the construction, so the saved file will be Newton.mgc).
Here is the figure you get (in edition mode, you can act on it) :
Now we will create a new figure. In this new figure we will implement our construction in an iterative way.
Use icon and create a new figure with an orthogonal frame.
Use icon and choose item Incorporate a construction from file.
A file select dialog box pops up. Browse to the directory you saved your connstruction to and click on button Open.
The Newton construction is now part of your figure.
Use icon to create a function named f with formal variable x et this formula (for instance) :
Let the checkbox Create curve checked and validate.
Now use icon  to create a point linked to the x-axis and name this point M.
Expanding the measures toolbar, use icon to measure the x-coordinate of point M in frame (O ; I, J). A dialog box pops up asking for the name of the measure. Enter xM.
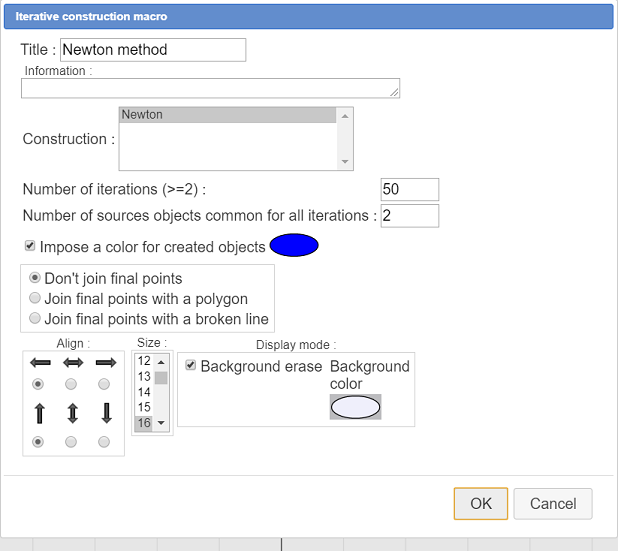
Expand the displays toolbar and, on it’s right, click on icon  . Choose item Iterative construction macro and fill in the dialog box as shown underneath :
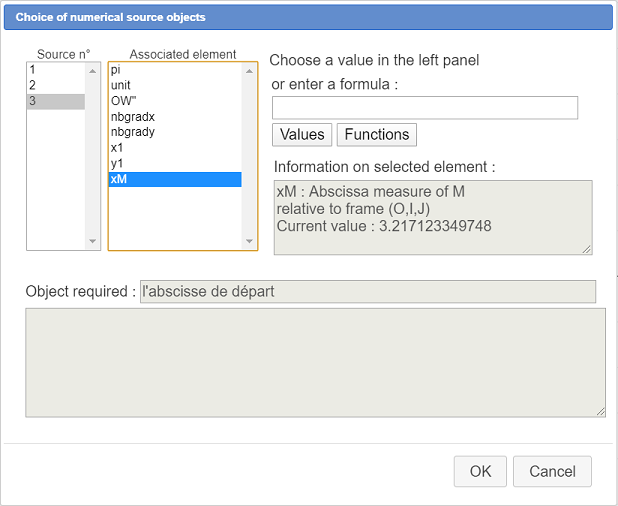
Then another dialog box pops up asking for the numerical sources objects choice. The first two will be shared by all the iterations. The third one (starting value for the sequence) will be replaced by calculation x on each iteration.
Fill in the dialog box as show here, assigning to source object number 1 the frame (O ;I,J), to source object number 2 the function f and to source object 3 the xM measure.
The macro appears.
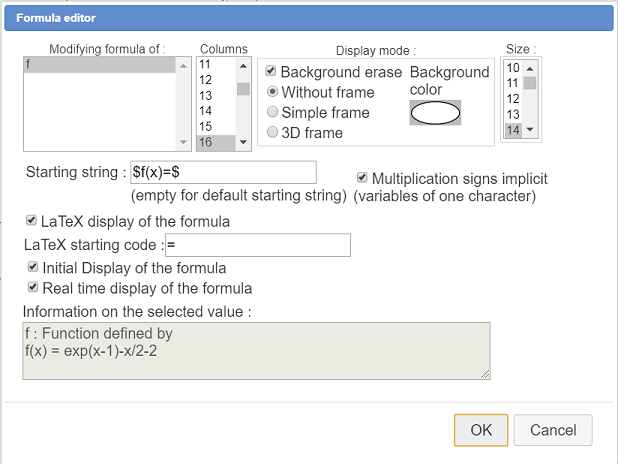
Now let us create a formula editor allowing us to modify the formula of f directly on the figure.
For this, expand the displays toolbar and use icon  . Click on the top left of the figure (under the macro Newton methos).
Fill in the dialog box like here :
You can move this formula editor with capture tool  (click and drag the left part of the editor).
If we execute our macro and then save the file it will contain a great amount of objects.
We are going to ask our iterative macro to be executed as soon as the figure is loaded.
For this, in the upper toolbar, click on icon  and click on Choice of a starting macro.
In the list click on Newton method and validate.
Now save the figure in the directory of your choice.
On the next opening of the figure, the macro will be executed. This is the case for the figure displayed underneath.
Then execute the macro using  (click on the macro).
Using tool  of the uper toolbar, you can see that a great amount of new objects have been added to the figure.
Voici le code Base64 de la figure avec démarrage automatique :
Clicking on icon  (upper toolbar) you will see that the figure contains now calculations named xa1, xa2, ..., xa50 that are in fact the 50 first terms of the sequence made of the abscissas of the intersection points of the tangents with the x-axis.
You can now capture point M to visualize the convergence speed according to the first term and also change the formula of function f. .
Here under a more sophisticated figure where the sequence terms are displayed using a recurrent sequence.
On the bottom right side of the figure, clic on buttons + ou - to see the value of this sequence terms.
You can act on this figure (figure in edition mode).
 Accueil
 Présentation
 FAQ
FAQ Contact

