
Logiciel libre de géométrie, d'analyse et de simulation multiplateforme par Yves Biton
Toutes les versions de cet article : [English] [Español] [français]
Réalisation :
Launch MathGraph32.
Keep in mind instructions are given on the indication line at the bottom of MathGraph32 window.
First create a free point (tool  )
)
. Just click at the location of the future point.
Let’s name the new point. Click on tool  , move the mouse pointer near the point and click when displayed this point. Enter K in the name filed of the dialog box. Click OK to validate. When this tool is active, you can drag names of points or lines (when the mouse pointer turns in a hand).
Now we have to create an horizontal line through point K. Click on tool  . Click on point K.The new line appears.
Let’s now create the line through K point, perpendicular to the horizontal line just created. Use tool  . Click first on the horizontal line the click on K point.
Let’s name this last line d. Click on tool the click on the perpendicular line.
Enter d in the field Name in the dialog box popping up.
We will now create a point linked to the horizontal line (tool  ). Get the mouse pointer near the line and click when displayed this line).
A new point appears on the line. This point is linked to the line : you are allowed to move it but it will remain on the line. Get this new point named F (tool ).
In a similar way, you will now create a point linked to d line and name it H.
We will now create the line through H point, parallel to the horizontal line. For this, click on tool  , then click on the horizontal line and on H point (in this order).
In the color palette, click on blue color.
You will now create the perpendicular bisector of [FH] segment (use tool and click on K and H).
In the color palette, click on red color.
Let’s now create the intersection point between this perpendicular bisector and the parallel line through H point. For this, use tool  and click on the two lines (don’t click at the intersection but anywhere on each line).
The intersection point appears. Name it M.
We will now create the point locus of point M through positions of linked point H. Use tool  . Then click on M. The linked points M is depending on are blinking. Click on H point. A dialog box pops up. Enter 200 for the number of points and don’t select checkbox "closed". Validate through OK.
The parabola appears in red.
With tool  , drag point F and observe the modification of the parabola.
When making a mistake, MathGraph32 allows the user to fix it.
Click on deletion tool  the click on point H.A dialog box pops up warning that depending objects wil also be deleted. Accept the deletion.
All the objects (including the parabola) ave disappeared.
Fortunately, MathGraph32 can undo the last actions on the figure.
Click on icon  to cancel the deletion. You can also us tool
  to redo the last action cancelled.
Let’s learn now how to modify the graphical characteristics of an object.
In the color palette, click on dark green color. In the line style palette, click on the thick line.
Click now on the palette tool ( ) and click on the parabola to get it modified.
Let’s now copy the figure in your favorite text writer.
Use menu item File - Edit - Copy. You can now use the paste command in your text writer (perhaps will it be better te resize the figure).
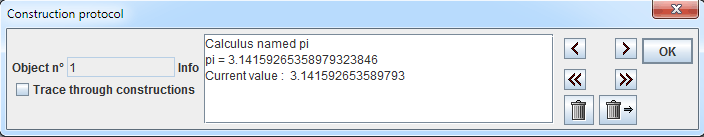
To review all the objects created, you can use the figure protocol (keyboard shortcut F5).
A floating dialog box appears as shown below :
Capture it and move at a place where the figure is visible.
Clicking on button > makes the following object appear and the text area gives information on the current objetc. Clicking on button < makes the preceding object appear.
A click on button << returns to the first object created.
A click on button >> returns to the last object created.
Icon  allows you to delete the current object and icon
  deletes the current object and all the following objects.
Click on OK to close the protocol dialog box.
Let’s now create a macro moving point H and animating the figure.
Use menu item Macro - New macro - Linked point animation.
A dialog box pops up.
Fill it as shown underneath and validate with OK.
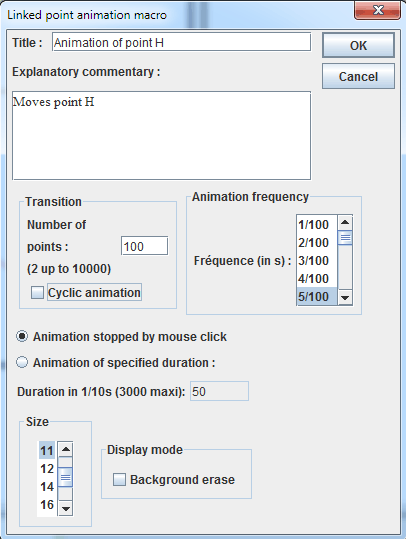
In the indication area, MathGraph32 asks to click on the linked point the macro will get animating : Click on H point.
The macro is now created and visible as a button.
To play the macro, click on tool  then click on the button representing the macro.
H point is now moving.
Click anywhere to stop the animation.
Let’s now create the object locus of the parabola generated through the positions of F point on the horizontal line.
In the color palette, click on blue color.
Use menu item Create - Object locus - Generated through linked point.
The indication area asks for the object traces of which the locus will be : click on the parabola.
Linked points the parabola depends on are now blinking. Click on F point.
A dialog box pops up asking for the number of positions for the ggeneration on the locus. Enter 50 and validate.
You can see underneath the figure animated through MathGraph32 JavaScript library :
 Accueil
 Présentation
 FAQ
FAQ Contact

