
Logiciel libre de géométrie, d'analyse et de simulation multiplateforme par Yves Biton
Toutes les versions de cet article : [English] [Español] [français]
You can see underneath the figure we intend to achieve.
Capture point A and B (they are free mobile points with integer coordinates).
You can see that :
If the line is vertical, the equation is displayed in the form x = constant.
If the points are at the same position, the equation disappears.
Use icon  of the upper toolbar, ask for a figure with frame (default choice) and choose an orthonormal frame.
Expand the points creation toolbar and click on icon  to create two points with integer coordinates you will name A and B (click on the spot of your choice).
Expand the measures toolbar and use icon  (x-coordinate measure in a frame). Click on point A and enter xA for name in the dialog box.
Proceed in the same way to measure the x-coordinate of point B end name it xB.
Now use icon  to measure the y-coordinates of points A and B et name these measures respectively yA and yB.
Now a remark that will be important in the following. As most of softwares calculating on computer, the values returned by a calculation are the results of calculations on approximated values and may suffer from tiny errors in the results.
Let us illustrate this on an example.
Expand the displays toolbar and click on icon  (value display), click on the spot of your choice and ask for a display of the value of xA with 16 digits like this :
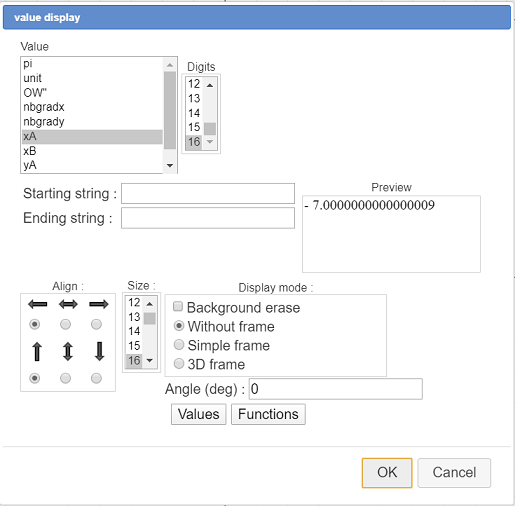
Here you can see that xA value is not exactly an integer value. Maybe it is an integer value but if you close the dialog box and capture the origin O of the frame you will set that, in some cases, the value of xA is not an integer.
In the following of this article, we will make sure to use only integer values for values used in a GCD calculation..
Use icon  to delete the display of xA value and let us go on.
When our line is not vertical, it’s reducted equations is in the form $y=ax+b$ with $a=\displaystyle\frac{y_B-y_A}{x_B-x_A}$.
Expand the calculations toolbar, and use icon  to create a new real calculation named dx with te formula :
 int(xB-xA+0.5) like underneath and validate :
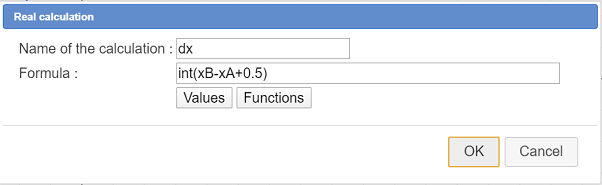
Why not use simply use the formula xB-xA ?
Later we will use dx in a GCD calculation. With the formula int(xB-xA+0.5) we round this difference to the nearest integer to avoid approximation problems like explained before.
In the same way create the following calculations (outil ) :
| Calculation name | Formula | Explanation |
| dy | yB-yA | |
| g | gcd(abs(dx),abs(dy)) | the absolute values are necessary because the gcd function does’t accept negative arguments |
| n | dy/g | Numerator ot the irreductible fraction |
| d | dx/g | Denominator ot the irreductible fraction |
The y-coordinate at the origin of our line (when it is not vertical) is given by the formula $\displaystyle b=y_A-a x_A=yA-\frac{n}{d}xA=\frac{d y_A- n x_A}{d}$
Again use icon (outil ) to create the following calculations :
| Calculation name | Formula | Explanation |
| nb | int(yA*d-n*xA+0.5) | |
| gb | gcd(abs(nb),abs(d)) | |
| n’ | nb/gb | Numerator ot the irreductible fraction representing b |
| d’ | d/gb | Denominator ot the irreductible fraction representing b |
| exist | dy<>0|dx<>0 |
exist value will be 1 if the line exists and 0 else. The operator <> returns 1 if the left and right operands are different and 0 else. | is the boolean operator or |
| vert | dx=0 | This calculation contains a test that will return 1 only if the two points have the same x-coordinate |
Now we will create a function of two variables that will be used to display the line equation in the form y=ax+b when the line is not vertical.
Expand the calculations toolbar and, on the right, click on icon  that makes available more tools.

Choose item Real function of two variables and fill in the dialog box as shown here.
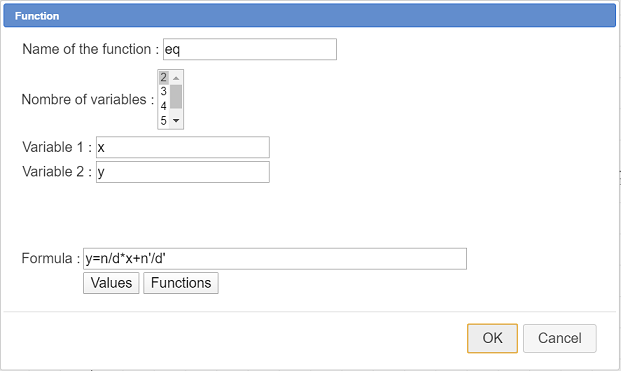
The formula to be used is : y=n/d*x+n’/d’
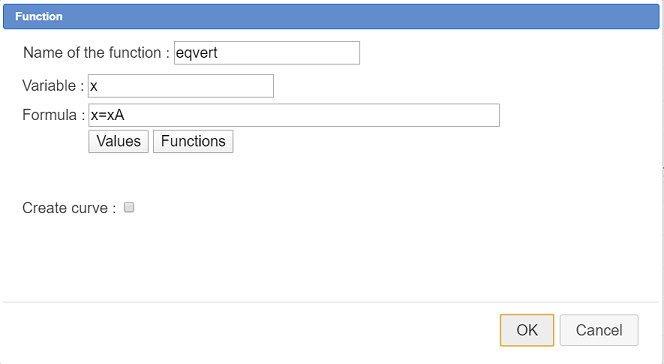
Now let us create a function we will use to display the line equation when the line is vertical.
Expand the calculations toolbar and click on icon  .
.
Fill in the dialog box as shown here (don’t forget to uncheck the checkbox Create curve).
Now we will create a LaTeX display that will display dynamically the line equation.
This LaTeX display will use two LaTeX codes specific to MathGraph32 :
Expand the displays toolbar and use icon  .
.
Fill in the dialog box as shown here :
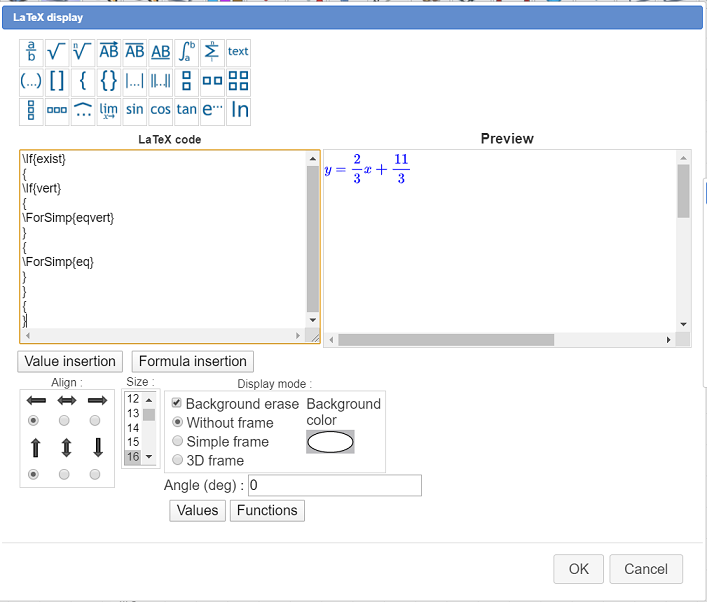
Here is the LaTeX code to use :
To sum up the way this LaTeX displays is working :
If the two points are the same place, we do nothing (last pair of braces).
Otherwise :
Now capture points A and B to see how the LaTeX displays vary according to the position of place of points A and B.
To be noted :
of the upper toolbar) and choose item LaTeX code display as shown underneath.
 Accueil
 Présentation
 FAQ
FAQ Contact

