Toutes les versions de cet article : [English] [Español] [français]
We want to creat the figure below (animated through MathGraph32 applet).
You can capture a and b.
Make sure that MathGraph32 uses radian as angle unity (menu item Options - Preférences, Angle unity tab.
Crate a new figure with a frame (for example with menu item File - New figure with - Frame without vectors).
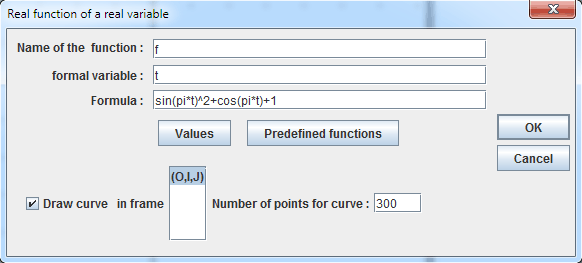
Use icon ![]() to create a real function named f defined by f(t)=sin(pi*t)^2+cos(pi*t)+1 as shown below :
to create a real function named f defined by f(t)=sin(pi*t)^2+cos(pi*t)+1 as shown below :

Set the checkbox DrawCurve selected so that the curve of the function will be created.
You can use icon ![]() (keyboard shortcut F5) to see how MathGraph32 creates a function curve.
(keyboard shortcut F5) to see how MathGraph32 creates a function curve.
In the color palette, activate the blue color.
Use tool ![]() to create a point linked to the x-axis and name this point a.
to create a point linked to the x-axis and name this point a.
Use tool ![]() to measure the abscissa of point a in frame (O,I,J). Un message pops up warning you that this measure is represented as xCoord(a,O,I,J)).
to measure the abscissa of point a in frame (O,I,J). Un message pops up warning you that this measure is represented as xCoord(a,O,I,J)).
Now use tool ![]() to create a calculus named a with formula xCoord(a,O,I,J) (use button Values).
to create a calculus named a with formula xCoord(a,O,I,J) (use button Values).
So a contains now the abscissa of point a.
Create point of coordinates (a + 2 ; 0) (tool ![]() ).
).
We will now create a text display linked to point a.
For this, use tool ![]() .
.
Click on point a. A dialog box pops up. Enter a + 2 in the text field and validate. This linked point will move with point a. You can use tool ![]() to change the position of the text relativaly to point a.
to change the position of the text relativaly to point a.
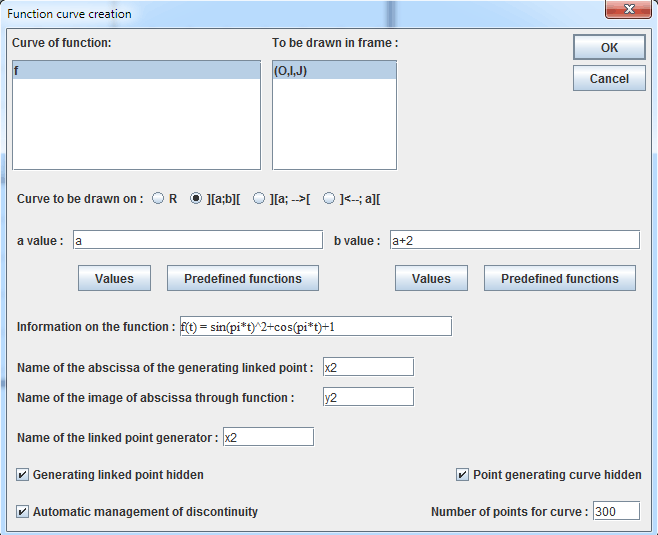
Let’s now create the curve of function f on [a ; a + 2] interval with tool ![]() .
.
In the dialog box popping up, set checked the item Curve to be drawn on ][a ;b][. Fill it as shown below :

In the filling style palette, click on ![]() . Then use icon
. Then use icon ![]() to fill the surface between this last curve and the x-axis (click first on the curve which is a point locus and then on the x-axis). When asked for the first or last object for the point locus, choose last object.
to fill the surface between this last curve and the x-axis (click first on the curve which is a point locus and then on the x-axis). When asked for the first or last object for the point locus, choose last object.
Now create points with coordinates (a ; f(a)) and (a + 2 ; f(a + 2)) (tool ![]() ) and then join with dotted segments points of coordinates (a ; 0) to (a ; f(a)) and (a + 2 ; 0) to (a + 2 ; f(a + 2)) (tool
) and then join with dotted segments points of coordinates (a ; 0) to (a ; f(a)) and (a + 2 ; 0) to (a + 2 ; f(a + 2)) (tool ![]() ).
).
Now mask the last curve (tool ![]() ). It is the last object.
). It is the last object.
In the color palette, click on green color.
Create now a point linked to the x-axis which you will name b (tool ![]() ) and measure the abscissa of b (tool
) and measure the abscissa of b (tool ![]() ).
).
Create a new calculus named b containing this abscissa ant then the curve of function f on interval [b ; b + 2] (tool ![]() ).
).
In the filling style palette, click on style ![]() .
.
Click on icon ![]() for a personalized color choice. A dialog box pops up. Choose a light green color and validate.
for a personalized color choice. A dialog box pops up. Choose a light green color and validate.
Just as before, create the surface between the curve of f on interval [b ; b + 2] and the x-axis.
Let’s get our figure improved to illustrate the fact taht our function f is perdiodical of period 2.
In the color palette, activate the black color and in the line style palette activate the thick continuous line.
Click on tool ![]() of vector creation. Click then on points of coordinates (a ; f(a)) et (a + 2 ; f(a + 2)).
of vector creation. Click then on points of coordinates (a ; f(a)) et (a + 2 ; f(a + 2)).
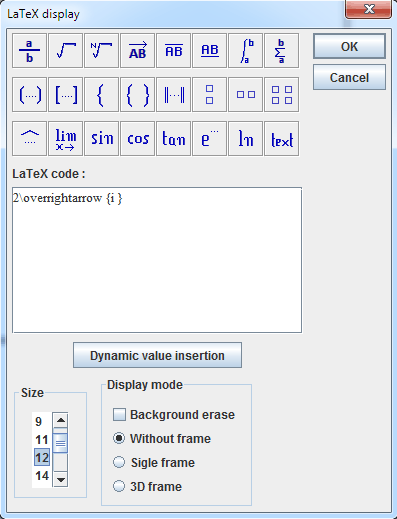
Let’s create now a special LaTeX display, this one will be linked to the point of coordinates (a + 2 ; f(a + 2)). It will display $2\overrightarrow{i}$
In the dialog box that pops up, enter 2 in the text editor then click on icon ![]() . In the LaTexCode adden, enter i between the brackets and validate just as below :
. In the LaTexCode adden, enter i between the brackets and validate just as below :

You can now use tool ![]()
to change the position of the LaTeX display relatively the the point.