Toutes les versions de cet article : [English] [Español] [français]
While testing MathGraph32 I happened to see properties I didn’t know.
One of these properties is about a complex recurrent sequence.
A well known property states that, if p is a real positive number, the real recurrent sequence défined by it’s first term $u_0$ and the formula $u_{n+1}=\frac{1}{2}\left( u_n+\frac{p}{u_n} \right)$ converges towards $\sqrt{p}$ (this result is known since the Antiquity under the name of Babylon algorithm or Heron method).
We will first study the complex recurrent sequence $(z_n)$ with first term $z_0$
MathGraph32 will help us visualize such a sequence and emit hypotheses. At the end of this article, I’ll propose demonstrations of these results.
Get MathGraph32 started.
Use icon ![]() and make sure that the level of is Advanced level with complex numbers calculation.
and make sure that the level of is Advanced level with complex numbers calculation.
Use icon ![]() to create a new figure with frame. A dialog box pops up. Choose an orthonormal frame and validate.
to create a new figure with frame. A dialog box pops up. Choose an orthonormal frame and validate.
With icon ![]() , create a free point and get this point named
, create a free point and get this point named
We will now measure the affix of this point in our frame. For this, use icon ![]() (expanding the measures toolbar).
(expanding the measures toolbar).
Click on the point $M_0$. A dialog box pops up asking for the name of the meausure. Enter z0 and validate.
We will now define the complex recurrent sequence $\left( z_n \right)$ with first term $z_0$ and defined by the recurrent formula $z_n+1=\frac12\left( z_n+\frac2iz_n \right)$.
Before this we must create a complex function f of a complex variable defined by $f(t)=\frac{1}{2}\left(t+\frac{2i}{t}\right)$.
Use icon ![]() (expanding the calculations toolbar).
(expanding the calculations toolbar).
A dialog box pops up. Enter f in the field Name of the function and t in the field Variable. In the field formula, enter 1/2*(t+2*i/t). Validate by OK.
Let us now define the complex recurrent sequence.
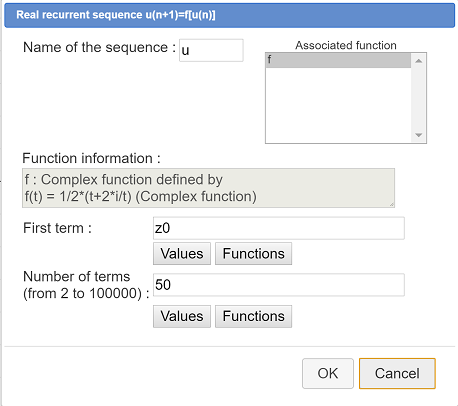
For this, use icon ![]() . A dialog box is opening. Fill it like this :
. A dialog box is opening. Fill it like this :

We now have to create the graph of this complex recurrent sequence. Each term of this sequence will be visualized by a point mark and these marks will be joined by segments.
In the color palette, set the blue color activated, and get the thin dotted line style activated in the line style palette.
In the style point palette, get the little circle activated (or the point style of your choice).
Use icon ![]() (expanding the locuses toolbar). Validate the dialog box popping up. The sequence graph appears.
(expanding the locuses toolbar). Validate the dialog box popping up. The sequence graph appears.
Use icon ![]() to capture point $M_0$.
to capture point $M_0$.
You get the figure below animated by the JavaScript library of MathGraph32 (You can capture point $M_0$).
In the figure above, the sequence seems to converge towards 1 + i. For other positions of $M_0$, the sequence seems to converge towards – 1 – i.
It is not a surpise if we remember that 1 + i et – 1 – i are the two complex numbers with a square equal to 2i.
When point $M_0$ is getting near the line of equation y = – x, a special behavior seems to happen. Let us study this with MathGraph32.
In the color palette, activate the black color.
Let us first create the line of equation y = – x (we will call it D). For this use icon ![]() (creation of a line by point and line slope).
(creation of a line by point and line slope).
Then click on point O.
In the dialog box popping up, enter – 1 in the field Slope. Validate by OK. The line appears. We wiil refer to this line as D.
Capturing point $M_0$, we see that, when $M_0$ is not on line D, all the graph points stay in the same half-plan of border D as point $M_0$.
Let us look now what happens when $M_0$ lies on line D.
For this, use icon ![]() (expanding the points toolbar). Click on point $M_0$, then on line D. The point $M_0$ has become a point linked to line D.
(expanding the points toolbar). Click on point $M_0$, then on line D. The point $M_0$ has become a point linked to line D.
Here is the figure we get (You can capture point $M_0$) :
Capture point $M_0$ with icon ![]() . It seems that all points with $z_n$ affix stay on line D et also that the behavior of the sequence is « chaotic ».
. It seems that all points with $z_n$ affix stay on line D et also that the behavior of the sequence is « chaotic ».
We will assume that :
– A complex sequence $\left( z_n \right)$ converges towards a complex $\ell$ when $\lim_{n \to {+\infty }} \left| z_n - \ell \right| = 0$.
– The usuals theorems on converging reals sequences can be generalized to complex sequences.
Let us write a = 1+ i et b = -a = -1 - i. We will call A et B points of affixes a et b = – a.
For each positive integer n, we have : $z_{n+1}-a = \frac{1}{2}\left( z_n + \frac{a^2 }{z_n } \right)-a=\frac{1 }{2 }\left( \frac{{z_n}^2+a^2-2az_n }{ z_n} \right)=\frac{1 }{2z_n }\left( z_n-a \right)^2$.
In the same way we get $z_{n+1}-b =\frac{1 }{2z_n }\left( z_n-b \right)^2$.
So we have now $\frac{z_{n+1}-a }{z_{n+1} + a } = \left( \frac{z_n-a }{z_n+a } \right)^2$.
We can demonstrate by recurrence that, for each n, $\left( \frac{z_n-a }{z_n+a } \right)=\left( \frac{z_0-a }{z_0+a } \right)^{2^n}$. We deduct from that : $\left| \frac{z_n-a }{z_n+a } \right|=\left| \frac{z_0-a }{z_0+a } \right|^{2^n}$.
Let us assume point $M_0$ is in the half-plan with border D containing A. So we have $M_0$ nearer from A than from B and so$\left| z_0-a \right| < \left| z_0-b \right| $ and we have $\left| \frac{z_0-a }{z_0+a } \right| < 1$. Then we deduct $\lim_{n \to {+\infty }}\left| \frac{z_n-a }{z_n+a } \right| = 0$ and we get that the complex sequence $\left( \frac{z_n-a }{z_n+a } \right)$ converges towards 0.
Yet we have $\frac{z_n-a }{z_n+a }=\frac{z_n+a-2a }{z+a }=1-\frac{2a }{z_n+a }$ so we get $z_n+a=\frac{2a }{1-\frac{z_n-a }{z_n+a } }$. Applying theorems on limits, we get that $(z_n + a)$ converges towards $2a$ and so $(z_n)$ converges towards a.
The exponent $2^n$ explains the extreme speed of the sequence convergence towards a = 1 + i.
In the same way we can demonstrate that, when$M_0$ is in the other half-plan with border D, the sequence converges towards b = – a.
Let us now focus on what happens when point $M_0$ lies on line D.
Let us call$M_n$ point with affix $z_n$.
We will first demonstrate that, when point $M_n$ A lies on line D, point $M_{n+1}$ is also on line D.
If $M_n$ lies on line D, $zn$ is of type $z_n = xia$ with x real(Indeed vector of affix i.a is orthogonal to vector $\overrightarrow{OA}$ of affix a).
Now we get $z_{n+1}=\frac{1 }{2 }\left( xia+\frac{a^2 }{xia } \right)=\frac{1 }{2 }\left( xia-i\frac{a }{x } \right)=\frac{1 }{2 }\left( x-\frac{1 }{x } \right)\times ia$, and it proves that $M_{n+1}$ lies also on line D.
By recurrence we deduct that all points $M_n$ are on line D.
Let us now state $z_n = x_n ia$. We get, for each n, $x_{n+1}=\frac{1 }{2 }\left( x_n - \frac{1 }{x_n } \right)$.
MathGraph32 will now help us explain the chaotic behavior of the sequence $M_n$ when $M_0$ is on line D.
Use icon ![]() to create a new figure with frame. A dialog box pops up. Choose an orthonormal frame and validate.
to create a new figure with frame. A dialog box pops up. Choose an orthonormal frame and validate.
Activate the blue color and the continuoux line style.
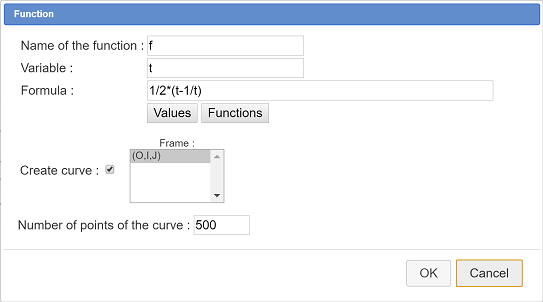
Use icon ![]() to create a function f of a real variable defined by $f(t) = \frac{1}{2} \left( t - \frac{1}{t} \right)$. Fill the dialog box as below. Let the checkbox Draw curve checked and validate.
to create a function f of a real variable defined by $f(t) = \frac{1}{2} \left( t - \frac{1}{t} \right)$. Fill the dialog box as below. Let the checkbox Draw curve checked and validate.

Let us now create the line of equation y = x with icon ![]() . Enter
. Enter y=x in the field Equation and validate by OK.
In the color palette, get the red color activated.
Use icon ![]() of linked point creation to get a point linked to the x-axis of the frame. Use icon
of linked point creation to get a point linked to the x-axis of the frame. Use icon ![]() to name this point x0.
to name this point x0.
Click on icon ![]() . This icon purpose is to measure the abscissa of a point realtive to a frame. Click on point x0. A dialog box pops up asking for the name of the measure. Enter x0 and validate.
. This icon purpose is to measure the abscissa of a point realtive to a frame. Click on point x0. A dialog box pops up asking for the name of the measure. Enter x0 and validate.
Let us now create the real recurrent sequence via ![]() (expanding the calculations toolbar).
(expanding the calculations toolbar).
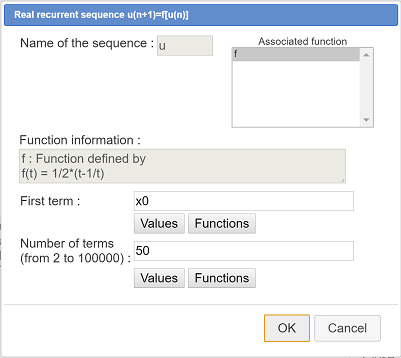
Enter u for the name of the sequence. Use Values button to enter x0 in the field First term. Enter 50 in the field Number of terms then validate by OK. Seee the dialog box below.

Now we have to create the graph of this sequence.
In the line style palette, get the tdotted line style activated .
Use menu icon ![]() in the locauses toolbar. A dialog box pops up. Let the checkbox Lines joining abscissa checked and validate by OK.
in the locauses toolbar. A dialog box pops up. Let the checkbox Lines joining abscissa checked and validate by OK.
You can now capture point x0 with icon ![]() to visualize the chaotic behavior of this sequence whatever is the value of the first term.
to visualize the chaotic behavior of this sequence whatever is the value of the first term.
Here is the figure we get (You can capture point x0) :
Let us explain this chaotic behavior :
This sequence cannot converge towards a real L for, otherwise, f being continuous, L would compute $f(L)=L\Leftrightarrow L-\frac{1 }{L }=L\Leftrightarrow -\frac{1 }{L }=0$ which is not possible.
It is obvious that, for x > 0, we have f(x) < x and, for x < 0, we have f(x)>x. We deduct that if, for instance, the first term of the sequence is positive, the sequence will start to decrease with positive terms. But, since the sequence is not allowed to be convergent, it cannot be minimized (theorem of the monotonous convergence). So, from an index, a term of the sequence will be negative. Then, from this term, the sequence will increase with negative terms. But since this sequence is not convergent, it is not maximized and, from some index, a term will be positive and so on.
We can also point out the fact that, for some values of the first term $x_0$ , the sequence may not be defined, for instance when $x_0 = 0$, or when $x_0=-1$.
The preceeding results can easily be generalized with the sequence defined by $z_{n+1}=\frac{1 }{2 }\left( z_n+\frac{a^2 }{z_n } \right)$ where a stands for a non null complex number. Indeed our preceeding calculations did not use a particuliar value of a.
Naming A and B the point of affixes a and – a, D the perpendicular bisector of segment [AB] (D has a directing vector of affix ia), it is easy to show that the preceeding results are still valid.
If the sequence is defined :
If $M_0$ is in the half-plan of border D containing A, the sequence converges towards a.
If $M_0$ is in the half-plan of border D containing B, the sequence converges towards -a.
If $M_0$ is on line D the all the points $M_n$ of $z_n$ affix are on this line with a chaotic behavior.
Let us illustrate this general result with a new MathGraph32 figure. The figure will be at the beginning the same as our first figure.
Use icon ![]() to create a new figure with frame. A dialog box pops up. Choose an orthonormal frame and validate.
to create a new figure with frame. A dialog box pops up. Choose an orthonormal frame and validate.
In the color palette. get the red color activated
With icon ![]() , create a free point. Use icon
, create a free point. Use icon ![]() to get this point named $M_0$.
to get this point named $M_0$.
We will no measure the affix of this point in our frame. For this, use icon ![]() . In the dialog box popping up, enter z0 as name for the measure.
. In the dialog box popping up, enter z0 as name for the measure.
In the color palette get the black color activated.
With icon ![]() , create another free point. Use icon
, create another free point. Use icon ![]() to name this point A.
to name this point A.
Use icon ![]() to create the image of point A through the central symmetry of center O (Click first on point O, the on A). Name this point B.
to create the image of point A through the central symmetry of center O (Click first on point O, the on A). Name this point B.
Use icon ![]() to create segment [AB] then icon
to create segment [AB] then icon ![]() to create the perpendicular bisector of segment [AB].
to create the perpendicular bisector of segment [AB].
Now measure the affix of point A (icon ![]() and click on A). In the dialog box popping up, enter a as name for the measure.
and click on A). In the dialog box popping up, enter a as name for the measure.
We must create a complex function f of a complex variable defined by $f(t)=\frac{1}{2}\left( t+\frac{a^2}{t} \right)$.
Ue icon ![]() in the calculations toolbar.
in the calculations toolbar.
A dialog box pops up. Enter f in the field Function name and t din the field Formal variable. In the field Formula, enter 1/2*(t+a^2/t). validate by OK.
Now we have to create the recurrent sequence.
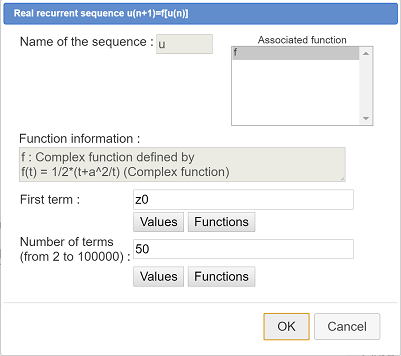
Use icon ![]() . A dialog box pops up. Fill it as below.
. A dialog box pops up. Fill it as below.

In the field Name of the sequence, enter z. In the complex functions list, function f is already selected. Use button Values to enter z0 in the field First term. Entrez 50 in the field Number of terms and validate by OK.
We now have to create the graph of this complex sequence.
In the color palette, get the blue activated and activate the dotted line style in the line style palette.
Now use icon ![]() and ask for the graph of sequence u. The graph appears.
and ask for the graph of sequence u. The graph appears.
You can now capture point A and point $M_0$ and notice that the preceeding result is universal.
Here is the figure we get (You can capture point A and point $M_0$) :
Let us now look at what happens when point $M_0$ lies on the perpendicular bisector of segment [AB].
Use icon ![]() , click on point $M_0$ then click on the perpendicular bisector.
, click on point $M_0$ then click on the perpendicular bisector.
You see that all the points of the graph stay on then line (it may happen that some points drift apart from the line : it is due to the accumulation of rounding numbers errors computing the complex calculations).
Here is the figure we get (You can capture point A and point $M_0$.) :
We have seen in that article that MathGraph32 is a very useful tool to get sophisticated figures in a few mouse clicks. Then we have the pleasure to demonstrate the results we observed.
Yves Biton (MathGraph32 author)