Toutes les versions de cet article : [English] [français]
Since version 3.2.8.2, the dialog box allowing the user to implement a construction has been improved.
When a construction being implemented is asking for sources objects, numerical sources objects must be specified first.
In the previous versions, every numerical source had to be assigned to a numerical object previously created.
Since version 3.2.8.2, when a real or complex value is needed as source object, it is possible to enter directly a formula in the dialog box of choice of numerical sources objects. A calculus will be automatically created and this calculus will be assigned as source object.
Let’s explain this in an example : we are going to use a predefined construction that will create a parametrical curve.
We will assume you are using MathGraph32 version 3.3.0 or higher available
on this page.
Use menu item File - New figure with and choose an orthonormal frame.
Assurez vous avec le menu Options - Figure en cours que l’unité d’angle de cette figure est bien le radian.
Click on icon ![]() of creation of a real function. A dialog box pops up.
of creation of a real function. A dialog box pops up.
Enter x in the field Name of the function, t in the field Formal parameter and, in the field formula, enter 2*sin(4*t)*sin(t)^2. Uncheck checkbox Draw curve and click OK.
In the same way, create another function named y with formula y(t) = 2*cos(2*t)*sin(t) without drawing the curve.
Then use menu item Constructions - Implement a predefined construction.
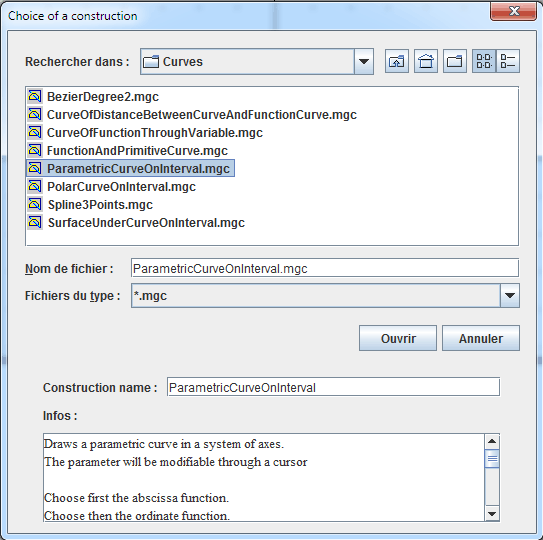
In the upper frame, double click on Curves directory.
Click on the file named ParametricCurveOnInterval. In the lower frame of the dialog box you can see informations about this construction.

Click on button Open. A dialog box pops up for the choice of numerical sources objects as shown above.
Cliquez sur le bouton Ouvrir . Une boîte de dialogue comme ci-dessous s’ouvre pour choisir les objets sources numériques.
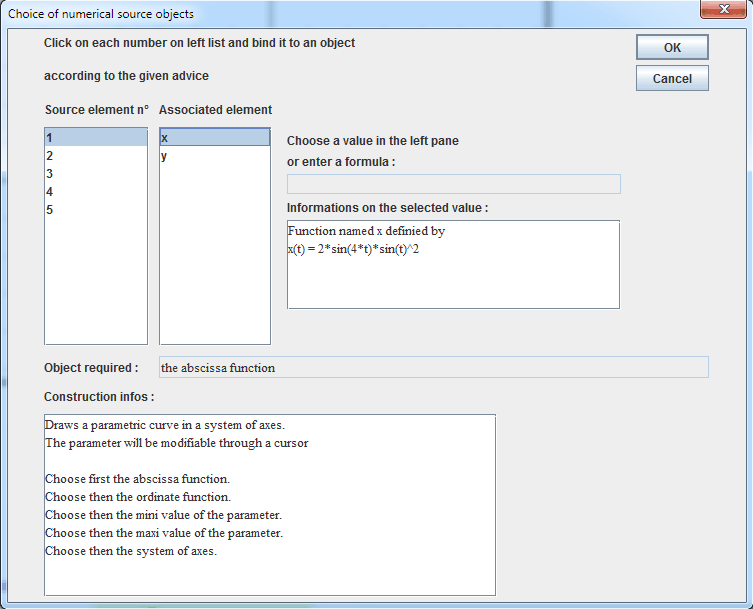
In the left list, click on number 1.
The field Object required indicates that the abscissa function is required.
Click on x as shown underneath.

In the same way, click on number 2 in the left list and click on y in the right list to choose y for second source object.
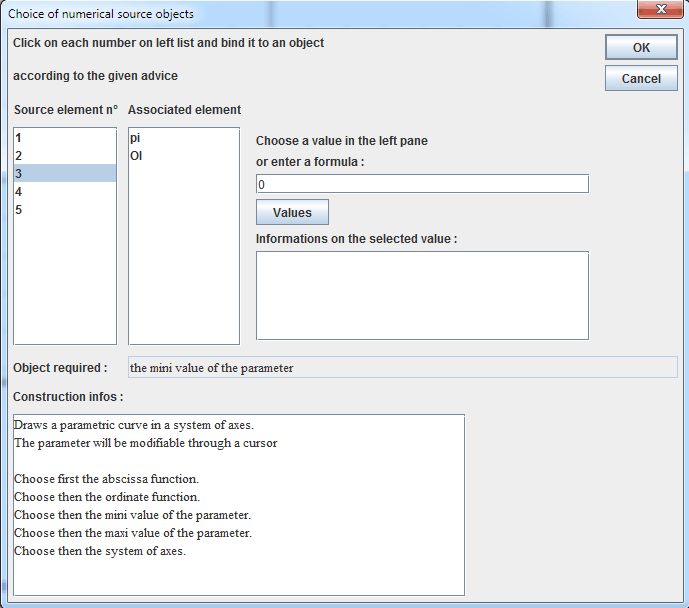
Click now on number 3.
The field Object required indicates that the construction wants the mini value of the parameter. We can assign an already defined value but we cal also enter directly a formula. Enter 0 as shown underneath.

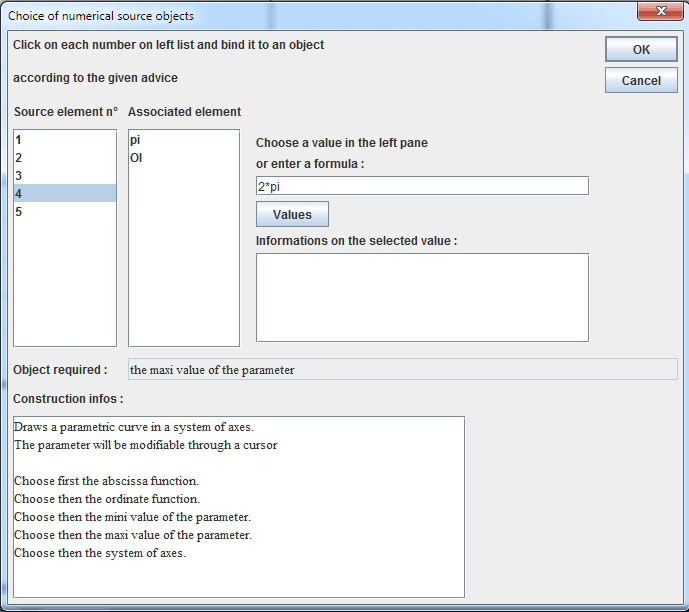
Now click on number 4 and enter 2*pi as formula for the maxi value of the parameter as shown underneath.

Click now on number 5. The required object is the frame in which the curve is to be drawned. Click on (O,I,J) et now validate by OK.
The figure appears.
Many objects have been created by the macro, including macros allowing the user to animate the figure.
Here under is the final figure :
You can capture t to make the parameter vary and click on a macro to get it executed.
To stop an animation, click again on the macro title.
To be noticed : A click on F6 key you will see that MathGraph32 created two calcules named a1 et b1 containing formulas 0 and 2*pi. These two calculus have been used as sources objects and can be modified.