
Logiciel libre de géométrie, d'analyse et de simulation multiplateforme par Yves Biton
Toutes les versions de cet article : [English] [Español] [français]
In this article I will show you how to create a construction which will create a LaTeX display of a given value as a fraction of pi, display linked to a point.
This construction will take three sources objects :
If you wish only to use this construction you can jump to the end of this article.
Use icon  to create a new figure without frame and without unity length.
Use icon  to create a free point at the place of your choice on the figure. This is the point our final LaTeX display will be linked to.
Use icon  to create two new real calculations as shown underneath :
| Nom du calcul | Formule | Commentaire |
| a | 1.2317*pi | This is the number to be represented as a fraction of pi |
| nbdec | 3 | This ios the number of digits from which value of a/pi will be rounded |
Now we are going to ask MathGraph32 to approximate value of a/pi in a rationnal fraction (this is done rounding at 10^(-12)).
For this we will use a matricial calculation named mat1.
Expand the calculations toolbar and, on the right, click on icon  making available more choices.
Choose item Matricial calculation to create a matricial calculation named mat1 filling in the dialog box as shown here :

Applied to a number, the function frac returns a matrix of one line and two columns. The first cell of this matrix contains the numerator of the approximated rationnal fraction of the argument and the second cell the denominator of this fraction.
Now use tool to create two real calculations as shown here :
| Calculation name | Formula | Explanations |
| num1 | mat1(1,1) | Contains the numerator of the approximated rationnal fraction of a/pi rounded to 10^(-12) |
| den1 | mat1(1,2) | Contains the denominator of the approximated rationnal fraction of a/pi rounded to 10^(-12) |
If mat is a matrix, mat(n, p) returns the term of mat which is at line number n and column number p.
If the denominator is greater than nbdec, we will round the fraction.
For this create the following real calculation :
| Calculation name | Formula | Explanations |
| b | int(a/pi*10^nbdec+0.5)/10^nbdec | Approximated value of a/pi rounded to nbdec digits |
Again expand the calculationns toolbar and click on icon to get more choices.
Choose item Matricial calculation and fill in the dialog box as shown here :
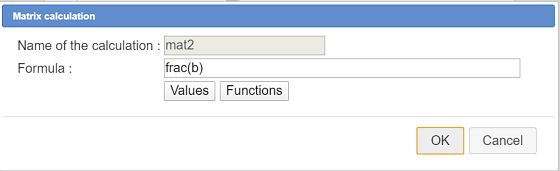
Now create two real calculations :
| Calculation name | Formula | Explanations |
| num2 | mat2(1,1) | Contains the numerator of the approximated rationnal fraction of b rounded to 10^(-12) |
| den1 | mat2(1,2) | Contains the denominator of the approximated rationnal fraction of b rounded to 10^(-12) |
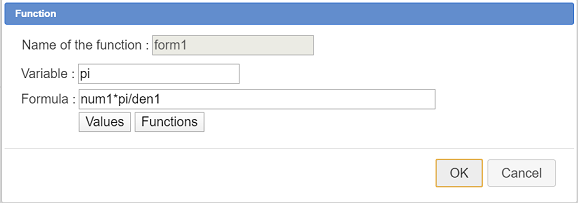
Now we are going to create two real functions of one variable named pi. They will be used to display the fraction of pi.
Use icon  to create a first real function named form1 as shown underneath :
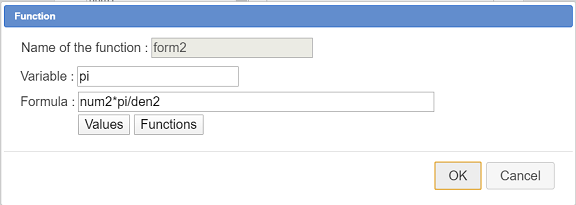
Create as well another function named form2 as shown here :
Use icon to create a real calculation as shown here :
| Calculation name | Formula | Explanations |
| test | den1<=1000 | Will return 1 if den1 est lower to 1000 and else 0 |
All we have got to do now is create the final LaTeX display which will be linked to the free point we created at the beginning.
Expand the displays toolbar and use icon 
Click on the free point the LaTeX display is to be linked to.
Fill in the dialog bow as shown underneath :

Here is the LaTeX code to be used in the dialog box :
\If{test}{\ForSimp{form1}}{\ForSimp{form2}}This LaTeX display uses a conditionnal LaTeX command (specific to MathGraph32) : if test value is 1 the LaTeX code used will be \ForSimp{form1} ans otherwise it will be \ForSimp{form2}.
\ForSimp{form1} will display the formula contained in fucntion form1 with simplification of the potential multiplications or divisions by 1. As we named the function variable pi the character π will be used in the LaTeX display.
Our figure is now ready for rhe macro construction creation.
You can now save your figure in a file as a precaution.
In the upper toolbar click on icon ![]() to get more tools.
to get more tools.
Icon  is for the construction creation.
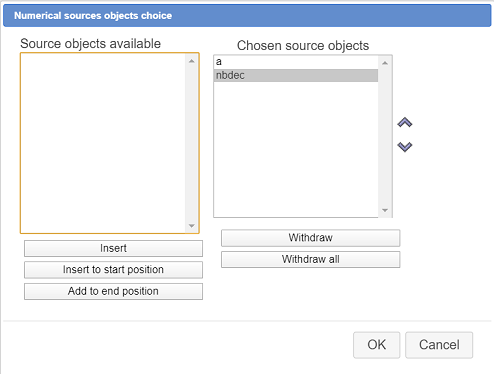
Click on first time on this icon and choose item Numerical sources objects choice.
A dialog box pops up. Use button Insert to choose as numerical sources objects the calculations a and nbdec as shown underneath and validate.
Click on icon and choose item Graphical sources objects choice.
Click on the free point the LaTeX display has been linked to then click on the red STOP button on the right bottom side of the window (to indicate that the graphical sources objects choice is done).
Click again on icon and choose item Graphical final objects choice.
Click on the LaTeX display (which is our only final object) then click on the red STOP button.
We must now finalize our construction.
Click again on icon and choose item Finish current construction.
A dialog box pops us. Fill it as shown here :
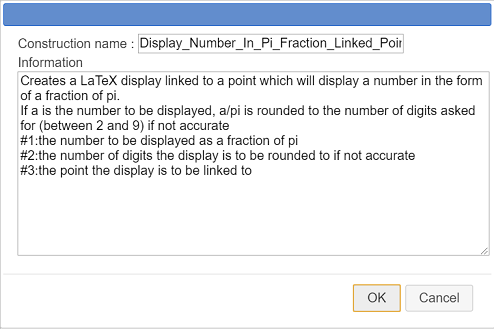
Here is the text to be entered in the Information field :
Creates a LaTeX display linked to a point which will display a number in the form of a fraction of pi.

If a is the number to be displayed, a/pi is rounded to the number of digits asked for (between 2 and 9) if not accurate

#1:the number to be displayed as a fraction of pi

#2:the number of digits the display is to be rounded to if not accurate

#3:the point the display is to be linked to
The last three lines of the information field contain indications which will be displayed when somebody will use our macro construction.
You can now save your figure. The macro construction is part of it.
But it is also better to save the macro construction in a separate file (a mgc file)
For this use icon  and choose item Save a construction of the figure.
Browse the the desired directory, choose a name for the file (it is wise to choose a name near the contrsuction name) and validate.
If necessary you can download this construction in the zip file underneath.

For instance create with icon a new figure with an orthogonal frame and with radian as angle unityand check the checkbox Trigonometry scaling.
Capture the point of coordonates (1 ; 0) on the x-axis to get it further for point O (the graduation pi must remain visible).
For our construction to be used in this new figure, we must icorporate it from the mgc file.
Use icon and choose item Incorporate construction from file.
Browse to the directory you saved yous mgc file in, select the file, and click on button Open.
The construction is now part of your figure.
Use icone  to create a point linked to the x-axis and name this point M.
Expand the measures toolbar and click on icon  : abscissa measure in a frame.
Click on point M and, in the dialog box popping up, choose xM as name for this measure.
We will now use this macro construction to display xM value in the form of a fraction of pi.
Use icon and choose item Implement a construction of the figure.
The construction is already selected. Click on button Implement.
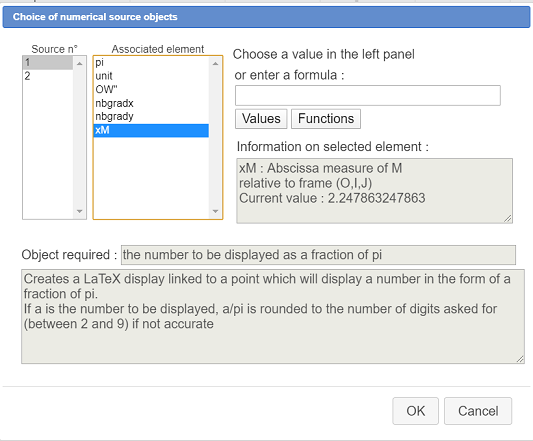
A dialog box pops up asking you for the two numerical sources objects choice. For each you can either use an already created object (compatible) or enter a formula.
Get assigned to the firts source object the calculation xM as shown here :
For the second source object (number of digits for the approxiamtion) enter directly the formula 3 as shown here :
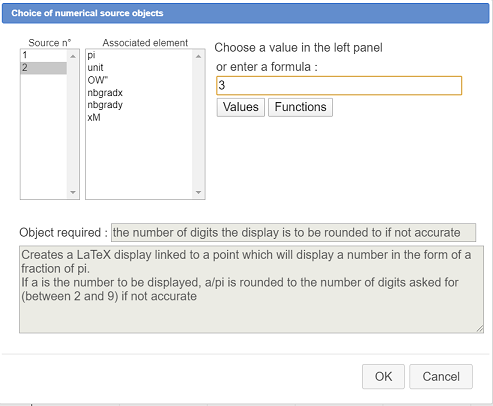
Then validate the dialog box.
On the top right corner of the figure you are asked to click on the point the LaTeX display is to be linked to : Click on point M
Our display appears, linked to point M.
You can modify the display mode of this LaTeX display using icon  and clicking on the display.
When capturing point M, you see the LaTeX display change dynamically.
Now we are going to use a matrix named Val to store eight values.
Expand the calculations toolbar, click on icon and choose item Matrix.
A dialog box pops up.
Enter 8 in the field Number of lines and 1 in the field Number of comumns.
In the edit fields, enter from top to botton the following formulas :
| Matrix cell | Formula |
| a11 | -pi/2 |
| a21 | -pi/3 |
| a31 | -pi/4 |
| a41 | -pi/6 |
| a51 | pi/6 |
| a61 | pi/4 |
| a71 | pi/3 |
| a81 | pi/2 |
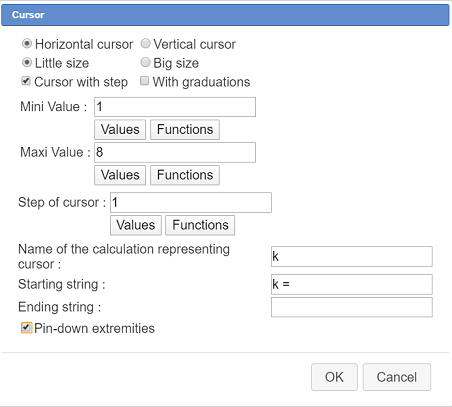
Now let us create a cursor with integer values ranging from 1 to 8.
Use icon  , click in the top left side of the figure (not too high), fill in the dialog box as shown underneath and validate :
Now create a real calculation with icon as shown here :
| Calculation name | Formula | Explanations |
| x | Val(k,1) | x represents the cell value of matrix Val at line k and column 1 |
Activate the red color and click on icon  to create the point of coordinates (x ; 0) in our frame.
We will now use our macro construction to display under point M the matching fraction of pi.
Use icon and choose item Implement a construction of the figure.
Our construction is already selected. Click on button Implement.
A dialog box pops up asking for the two numerical sources objects just as before.
Assign to the first source object calculation x and, for the second source object, enter formula 3 then validate.
As asked, click now on the point of coordinates (x ; 0).
Our LaTeX display with a fraction of pi appears. You can change it’s color using tool palette  in the upper toolbar.
Use capture tool  to make the cursor vary.
You can see the LaTeX display updating according to the cursor value (value of k).
To be noted : If we had only used an approximated value in our construction we would’nt get here the good fractions of pi.
To complete our figure, we would like to graduate aou x-axis with aall the fractions of pi mathching the values contained in matrix Val.
For this we will use two object locuses generated by a variable (we van’t use the cursosr because itis a cusor with interger values).
Use icon to create a variable named p with th following features :
Don’t chech the checkbox Associated dialog.
Create a new real calculation with the following features :
| Calculation name | Formula | Explanations |
| x’ | Val(p,1) | x’ represents the cell value of matrix Val at line k and column 1 |
Use icon to create the point of coordinates (x’ ;0)
Now let us create the object locus of ths last point generated by the variable p.
Use icon ![]() . Choose variable p in the list and validate.
. Choose variable p in the list and validate.
Now you are asked to click on the obect tarces of which will generate the locus : click on the point of coordinates (x’ ;0).
A dialog box pops up sking for the numer of objects for this locus : enter 8 and validate. The locus appears, made of 8 points.
Now let us apply our construction to the value of x’.
Use icon and choose item Implement a construction of the figure.
The construction is already selected. Click on button Implement.
A dialog box pops up asking for the two numerical sources objects just as before.
Assign to the first source object calculation x’ and, for the second source object, enter formula 3 then validate.
As asked, click now on the point of coordinates (x’ ; 0).
The LaTeX display appears.
Now we are going to ask for an object locus of this last LaTeX display.
Use again icon ![]() . Choose variable p in the list ans validate.
. Choose variable p in the list ans validate.
Now you are aske to click on the object traces of which will generate the object locus : click on the las LaTeX display created by the construction.
A dialog box pops up sking for the numer of objects for this locus : enter 8 and validate. The locus appears, made of 8 LaTeX displays.
Use icon  to mask the lastLaTeX display created (used for the object locus).
But we have a problem : our object locus is masking the LaTeX display varying when the cursor is moved.
There are several options to fix this up : let us use object reclassifying.
Move the cursor to the value k = 4 for instance.
In the upper complementary toolbar , click on icon  (reclassifing of object towards the end) and click on the display of pi/6.
You are asked to choose between object locus and LaTeX display. Choose LaTeX display and validate.
If not already done, give to this LaTeX display the red color using palette too .
You can also use tool to modify this LaTeX display and check the checkbox Erase background.
Here is the final figure (you can capture the cursor and the point M and you can even implement the construction one more time) :
 Accueil
 Présentation
 FAQ
FAQ Contact

