
Logiciel libre de géométrie, d'analyse et de simulation multiplateforme par Yves Biton
Toutes les versions de cet article : [English] [Español] [français]
This article has been adapted to the JavaScript version of MathGraph32.
Expanding the displays toolbar, MathGraph32 allows the user to display LaTeX display using icon  (free LaTeX display) or
  (LaTeX display linked to point).
Create a new figure with icon  of the upper toolbar, choose Figure with frame and ask for an orthonormal frame.
With icon  create a free point with integer coordinates and name it M on the fly or with icon
  . You can move the name with tool
  of the upper toolbar.
Expanding the measures toolbar (fourth from the bottom), use icon  to measure the x-coordinate of M and icon
  to measure the y-coordinate of M. Give the names x and y to these two measures.
Now create a point of coordinates (x ;0) àwith icon  .
.
We are going to create a value display linked to the last point with icon  . First click on the last point created.
A dialog box pops up. Fill it like like underneath :
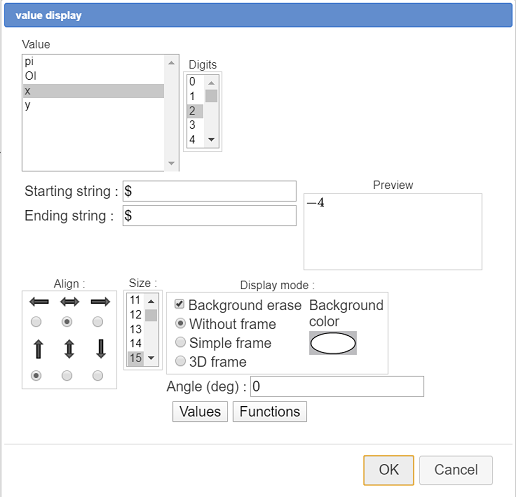
Select x in the list. In the field starting string En-tête, enter a \$ character and, in the field Following string enter also a \$ character. These two \$ characters are optionnal. Using them will make the x value display with the LaTeX style. Validate. You can move the position of the display value relatively to x with icon  .
.
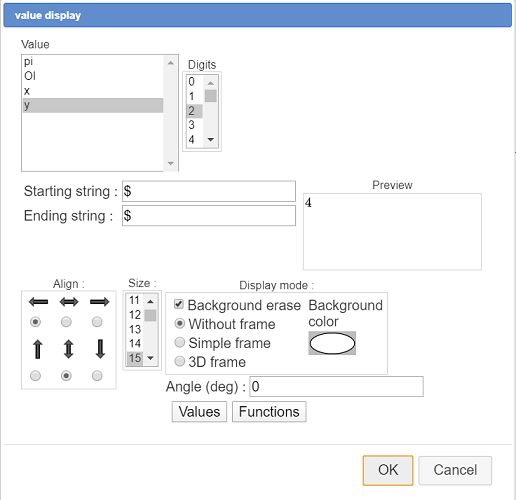
In the same way, create a point of coordinates (0 ; y) and a value display of y linked to this last point with a \$ character in the fields Starting string and Ending String.
Move slightly this display to the right.
In the line style palette, activate the dotted line style and a width of 2 pixels, then use icon to join with segments the point M and the two points of coordinates (x ;0) et (0 ; y).
Now we will create a LaTeX display containing a matrix of several lines showing how to calculate length OM.
First use icon  to create a calculation named dis with the formula
 {sqrt(x^2+y^2)}.
Click on icon then click on the top left corner of the figure. A dialog pops up to enter the LaTeX code.
First use icon  to get the LaTeX code of a 2 columns matrix.
In the second line, enter the code \text{Distance between O and M is :} (you can use button  ), and, in the third line, after the two \ characters, enter the code
 \text{OM =} then click on icon  . MathGraph32 has just inserted the LaTeX code for a square root. Inside the braces, enter
 \left( \right)^2 + \left( \right)^2 (use icon  for the parenthesis).
Set the caret position inside the first couple of parenthesis and click on button Value insertion. In the dialog box popping up, click on x then click on button OK. In the same way, set the caret position inside the second couple of braces (before the second ^2) and click on button Value insertion to insert the code for dynamic display of y. Enter a character ≃ (use the box of special characters) then clcik on button Value insertion to insert the LaTeX code for a display of dis value with three digits.
The LaTeX code has to be :
\begin{array}{l}
\text{La distance entre O et M est :}
\\ OM = \sqrt{\left( \Val{x} \right)^2 +\left(  \Val{y} \right)^2} \approx \Val{dis,3}
\end{array}
You can see that, on the fly, when you modify the LaTeX code, you can see what will be displayed in the preview frame.
Validate te dialog box.
Now you can capture point M with tool
Here is the dynamic figure you must finally get :
Capture point M.
 Accueil
 Présentation
 FAQ
FAQ Contact

