Toutes les versions de cet article : [English] [Español] [français]
This article is now adapted to the JavaScript version of MathGraph32. It shows how to create a macro construction to create the image of a circle through a complex transformation.
Create a new figure with icon  and choose a new figure with an orthonormal frame.
Use icon  to create two free points then icon
 to create a circle with the first point as center and going through the other point.
With icon  create a point linked to this circle and name it M .
Expand the measure toolbar and use icon  ti create the affix measure of point M in our frame (just click on point M). Enterz as name for this measure.
Expand the calculations toolbar and use icon  to create a complex function named f defined by f(t) = t+1/t.
The icon  will allow us to create a complex calculation named z’ with formula f(z).
Now create the point of affix z’ using icon  . Name this new point M’.
We are now going to create the point locus of point M’ generated by the positions of point M on the circle M is linked to.
In the color palette use the red color.
Click on icon  (point locus generated by linked point). First you are asked to click on the point traces of which will gennerate the locus : click on M’. Then you are asket to click on the linked point position of which will generate the locus : click on M. A dialog box pops up. Ask for 500 points and check the checkbox Closed locus then validate. The point locus appears.
Now is the time to create our macro construction.
In the upper toolbar, click on icon  making a few more icons available.
First we have to choose the sources objects of our construction.
Let’s start with the numerical sources objects.
Use icon  (construction creation) and click on Numerical sources objects choice.
A dialog box pops up. Our two numerical sources objects are the complex function f and the frame (O,I,J)
Click on frame (O,I,J) (or double-click on it) the do the same with function f as shown underneath :
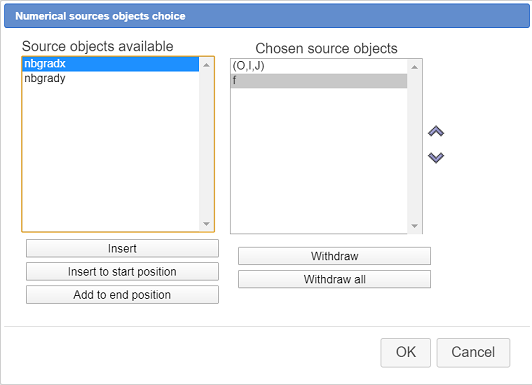
.
Now we have to choose the graphical sources objects. For this use again icon  and choose Graphical sources objects choice. Click on the circle then click on the red button STOP on the right bottom side of the window.
Now we have to choose the final objects of our macro construction. Let us start with the graphical ones.
Use icon  and choose Final graphical objects choice.
You can click only objects exclusively created from the chosen sources objects. Click on M, on M’ and on the point locus. On the bottom right side of the window, click on the red button STOP to show that you are finished with the graphical final objects designation.
Let us now choose the numerical final objects.
For this use again icon  and choose Numerical final objects choice.
Click on z, z’ like underneath.
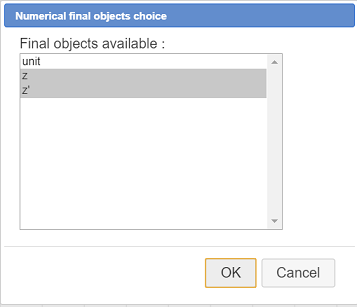
Now we have to finalize our construction and save it in a file.
Use again icon  and choose Finish current construction.
Fill in the dialog box as shown here :
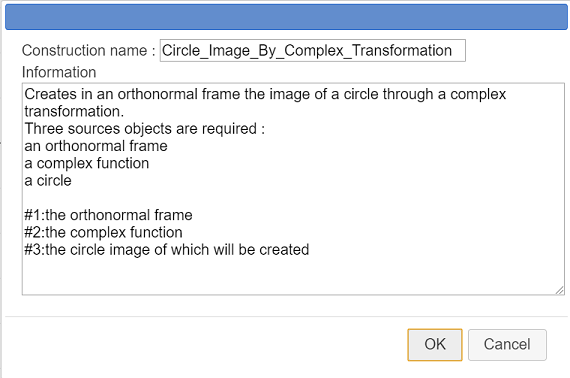
Here is the information to use is the dialog box :
Creates in an orthonormal frame the image of a circle through a complex transformation.
Three sources objects are required :
an orthonormal frame
a complex function
a circle

#1:the orthonormal frame
#2:the complex function
#3:the circle image of which will be created
The last three lines provide information that will be displayed when the user will implement this construction.
Now save your construction in a file using icon  then choosing Save a construction of the figure (it is better to give to the file the same name as the name of the construction or a similar name).
Now we are going to show how to use this construction in another figure.
Use icon  and ask for an orthonormal frame then, in the dialoge box, check the checkbox With vectors . Use the capture tool to get the point of abscissa 1 on the x-axis further from point O.
Use icon  to create a complex function named f définined by f(t) = t+1/t^2.
With tool  create a point linked to the x-axis we will call A, then the circle of center O and going through A. Better if the radius of this circle is lower than 1.
Let us use our construction : use icon  (constructions management) and choose item Incorporate construction from file. A dialog box pops up. Open the file you saved your constriction to (.mgf file), the click on buttonOpen.
The construction is now part of our figure.
Now we have to implement this construction.
Use agian icon  and choose item Implement a construction of the figure.
A dialog box pops up displaying all the constructions available (on ly one here which is already selected). Click on button Implement.
A new dialog box pops up for the choice of the numerical sources objects. The frame (O,I,J) is already selected as numerical source object number 1.
In the left list, click on number 2. In the right list, select function f as underneath. Validate.
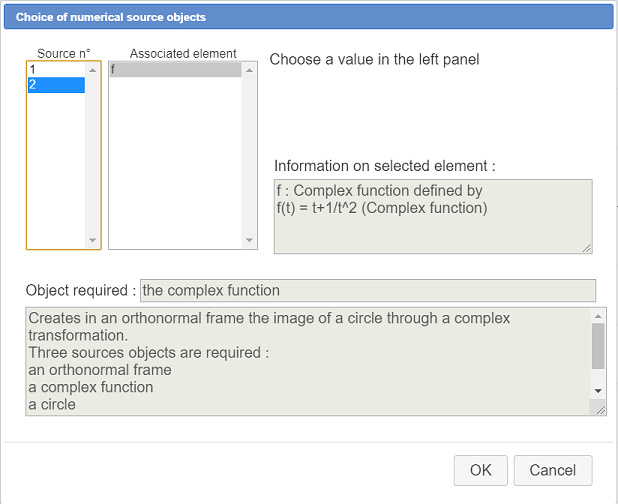
On the top left corner of the window is displayed (temporarily) the indication we spécified for the third source object (the circle).
Click on the circle.
The point locus image of the circle through transformation f appears, along with points M an M’. All these objects have been created by implementing the macro construction.
You can capture the linked point A and see the point locus updating in real time.
You can also capture the linked point M and see it’s image M’ vary.
Clicking on icon  you will see that new numérical objects have also been created by the construction, two complex calculations named z and z’ which are the affixes of points M and M’.
To finish we are now going to create a formula editor allowing to modify f formula directly on the figure.
For this, use icon  expanding the displays toolbar.
Click on the top left corner of the figure then fill in the dialog box as shown here :
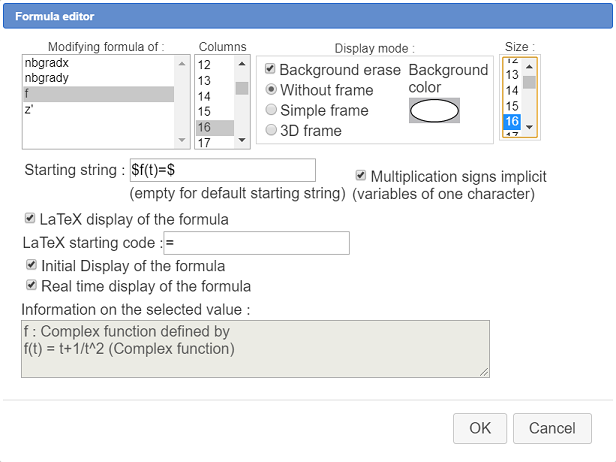
You can move this formula editor with capture tool ( ) . For this click on the left part of it.
Using characters $ at the beginnig and the end of the edit field Starting-string we get the starting string displayed in LaTeX mode.
You can see underneath the figure animated by MathGraph32 online.
You can modify f formula.
For instance try formula $f(t)=1/2*\left(t+\frac{1}{t}\right)$